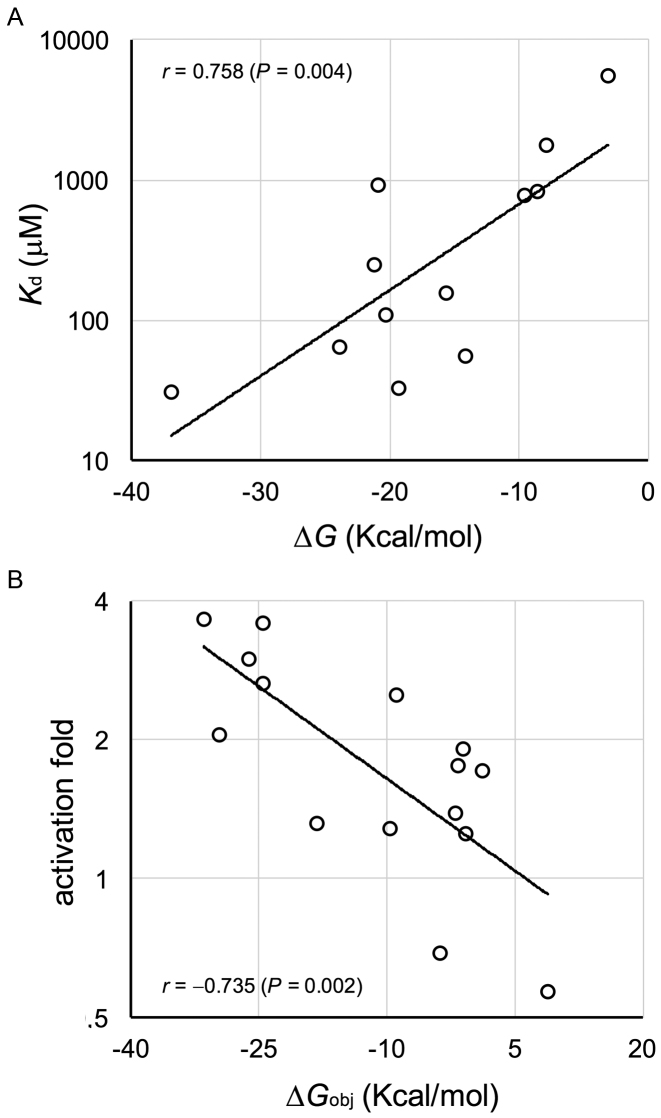
Figure 7.
Predicted free energies versus activity of designer RNA hybridization networks. (A) Linear correlation between the apparent dissociation constant (in log scale) and the free energy of hybridization. The data shown are for systems trigR2, trigR11 and trigR31, considering the potential interactions between SR and SRR, SR and SRRR, SRR and SRRR, and SRR* and SRRR. Two-tailed Student t-based correlation test, P < 0.05. (B) Linear correlation between the activation fold (in log scale, relative to the uninduced state) and the objective energy of hybridization. The data shown are for all systems, considering the fluorescence increase due to aTc, IPTG and finally aTc and IPTG. Two-tailed Student t-based correlation test, P < 0.05.

