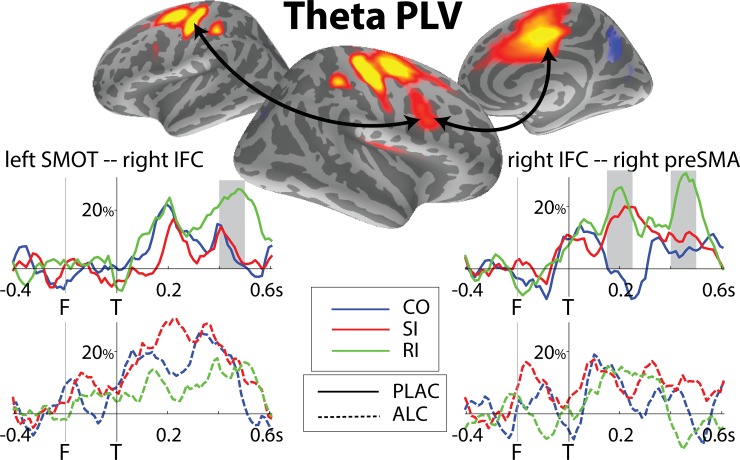
Fig 6. Group average maps and timecourses of phase-locking values across pairs of ROIs in theta band.
‘F’ and ‘T’ correspond to flanker (at -200 ms) and target (0 ms) presentation respectively. PLV is expressed in percent change from baseline. The right IFC shows increased synchronization with the lateral (SMOT) and medial (preSMA) motor regions. In the earlier time window (150–250 ms), higher PLV is found between the right IFC and right preSMA to both types of incongruity. In the later time window (400–500ms), the IFC co-oscillates with the SMOT and preSMA on RI trials only, indicating their engagement in response execution under conditions of response switching. Alcohol dysregulates co-oscillations between both pairs of ROIs.

