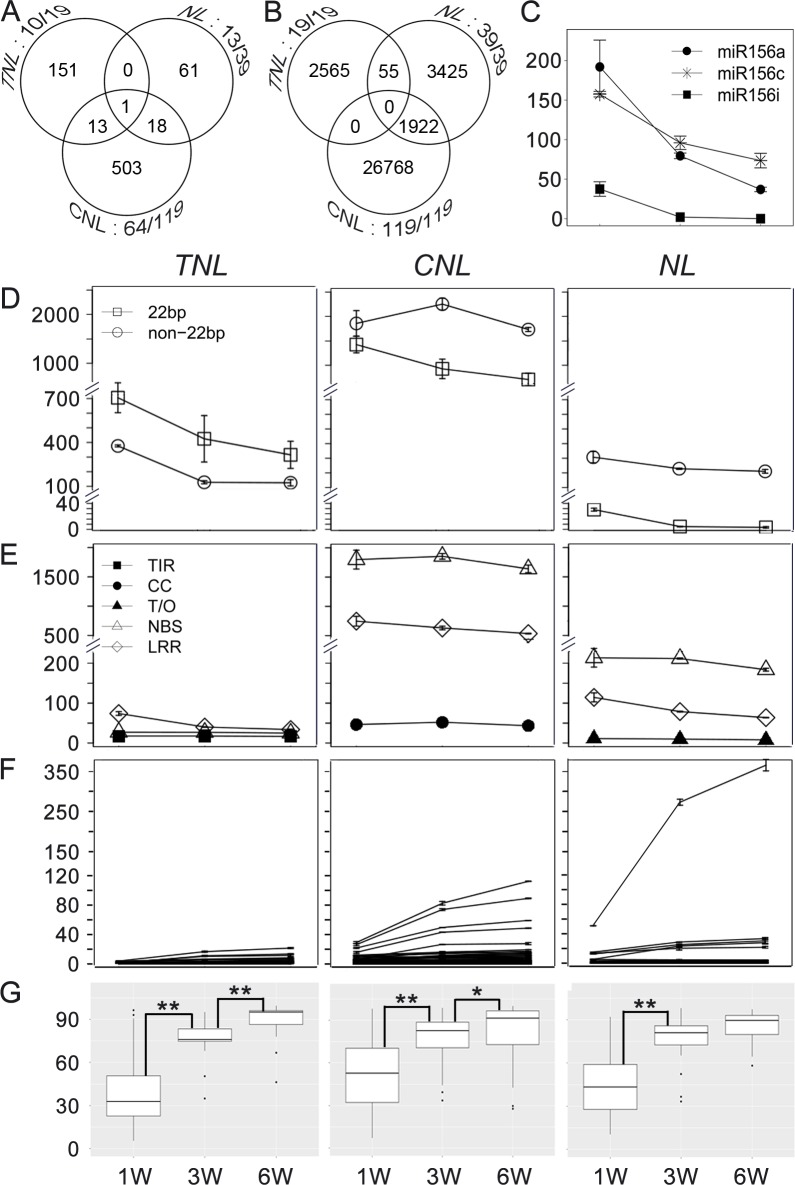
Fig 1. Regulation of the majority of NLRs by sRNAs in D51 tomato plants during growth.
(A) Venn diagram for numbers of NLR silencers targeting different classes of NLRs in tomato. Three circles represent the number of silencers targeting TNL, CNL and NL, respectively, as indicated in each circle. Numbers next to each circle indicate the number of silencer targeted NLR genes out of the total numbers in each class. (B) Venn diagram for numbers of secondary siRNAs derived from different class of NLRs in tomato. Three circles represent secondary siRNAs derived from TNL, CNL and NL, respectively, as indicated in each circle. Numbers next to each circle indicate the number of NLR genes with secondary siRNAs out of the total number in each class. (C) Expression profile of the conserved miR156 members. (D) TNL (left), CNL (middle) and NL (right) silencer expression profile at 1-, 3- and 6 WAG stages. Open square, 22-nt silencer; open circle, non-22-nt silencer. Each line represents an individual silencer. (E) TNL (left), CNL (middle) and NL (right) secondary siRNA expression profile at 1, 3 and 6 WAG stages. Filled square, TIR of TNL; filled circle, CC of CNL; filled triangle, N-terminal region of NL; open triangle, NBS region of all NLR; open diamond, LRR region of all NLR. Each line represents an individual gene. (F) TNL (left), CNL (middle) and NL (right) gene expression profile at 1-, 3- and 6 WAG stages. Each line represents an individual gene. (G) The box plot of data in E. Asterisks indicate statistically significant differences between expression levels of NLRs at two time-points (*, 0.01<P<0.05; **, P<0.01). The statistical analysis was conducted using the R t.test method and plotted using the R ggplot2 package. Y axes are all in TPM units.

