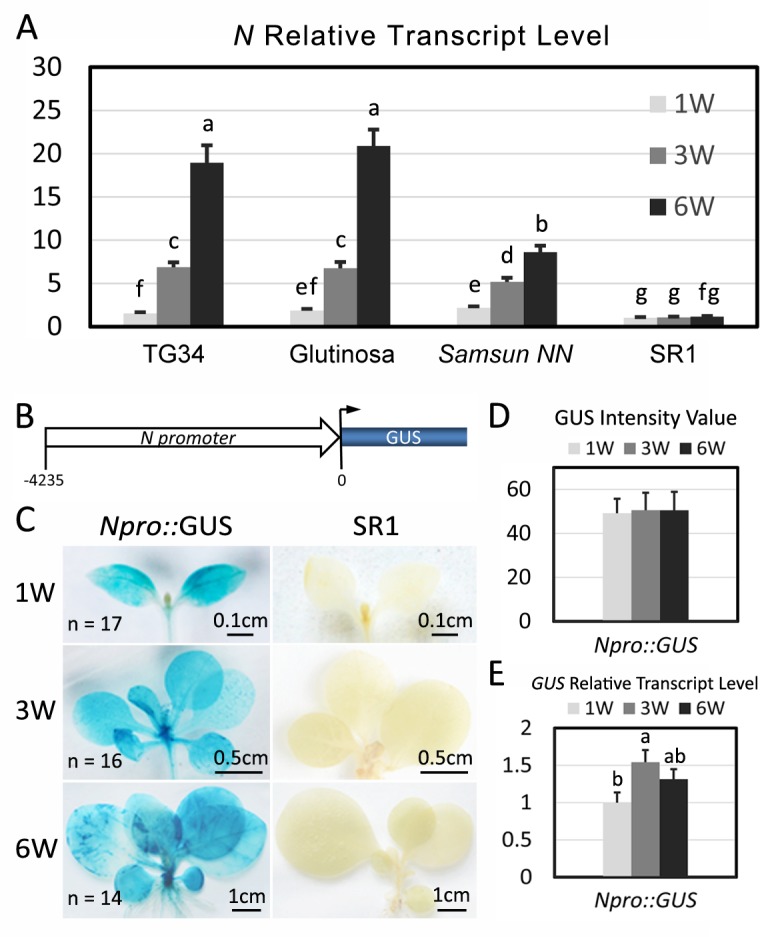
Fig 3. N expression increases as seedlings mature.

(A) Relative N transcript levels at 1-, 3- and 6 WAG were determined by quantitative real-time reverse transcription-PCR (RT-qPCR) in Nicotiana glutinosa (Glutinosa), Samsun NN, TG34 and SR1 plants. The GAPDH gene was used as the reference gene. (B) Map of the N promoter Npro::GUS construct showing the N gene promoter and GUS CDS. (C) GUS staining of Npro::GUS transgenic plants and SR1 controls at 1-, 3- and 6 WAG. The number (n) of stained plants and the length of each bar are indicated on the image. (D) The intensity of GUS staining in transgenic Npro::GUS seedlings at 1-, 3- and 6 WAG was measured by image analysis and the relative values of GUS staining intensity are plotted. (E) The relative levels of GUS mRNAs determined by qRT-PCR in Npro::GUS seedlings at 1-, 3-, and 6 WAG. The data are the means of three replicates with SD (standard deviation). Different letters indicate significant differences between the treatments according to One-Way ANOVA (analysis of variance) test (P < 0.05). Y axes all indicate relative fold differences.
