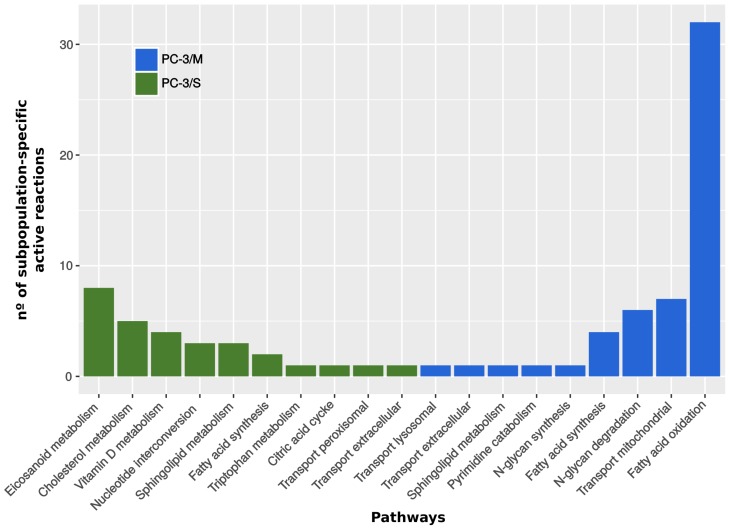
Fig 1. Subpopulation-specific active metabolic reactions and their associated metabolic pathways: This figure illustrates the number of reactions active only in one of the subpopulations and the corresponding pathway.
Blue bars are the active reactions in PC-3/M cells and inactive in PC-3/S cells. Green bars are the reactions active in PC-3/S cells and inactive in PC-3/M cells. The p-value associated to the significance of reaction activity prediction is below 0.01 (Supplementary information S2 File).

