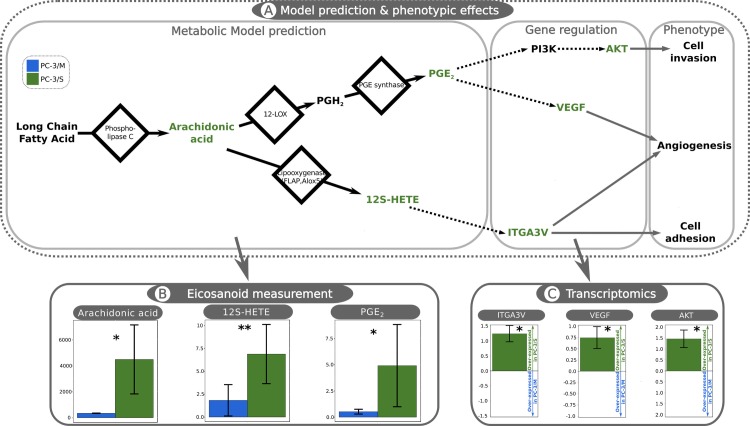
Fig 3. Metabolomic measurements reveal major differences in eicosanoid metabolism between PC-3/M and PC-3/S cells.
A: Computational predictions of Eicosanoid metabolism and reported effects on tumor progression involving several gene regulatory mechanisms. The computational analysis predicts a more active eicosanoid metabolism in PC-3/S cells. The left-most box (Metabolic Model prediction) represents a set of eicosanoid metabolism intermediates with significant differences between subpopulations and their associated reactions. Black solid arrows, metabolic reactions; nodes, metabolites; green highlight, measured metabolites. Long-chain fatty acids, Arachidonic acid, 12S-HETE: 12(S)-hydroxy-5Z,8Z,10E,14Z-eicosatetraenoic acid, PGH2: Prostaglandin H2, PGE2: Prostaglandin E2. The central box (Gene regulation) illustrates the gene regulatory interactions associated with eicosanoid metabolism. Green highlight, measured genes; black non-continuous arrows, gene regulatory pathways. ITGA3V: Integrin alpha v3; VEGF: Vascular Endothelial Growth Factor; PI3K: Phosphoinositide 3-kinase; AKT. Right panel (phenotype): reported effects on tumor progression, connected to the associated metabolite or gene through gray solid arrows. B: Metabolic measurements of detected species in both PC-3/M (blue bars) and PC-3/S cells (green bars). Shown are mean values ± sd. The units are in fmol/106cells. C: Transcript levels of genes associated with eicosanoid metabolism and tumor progression. The figure represents the mean value of log2 FC between PC-3/S (green bars) and PC-3/M (blue bars) ± sd. Both, metabolite level and gene expression were determined by measuring three independent samples. The level of significance was calculated using the Wilcoxon-Mann-Whitney U test, where p-values < 0.05 are indicated as “*” and < 0.1 as “**”.

