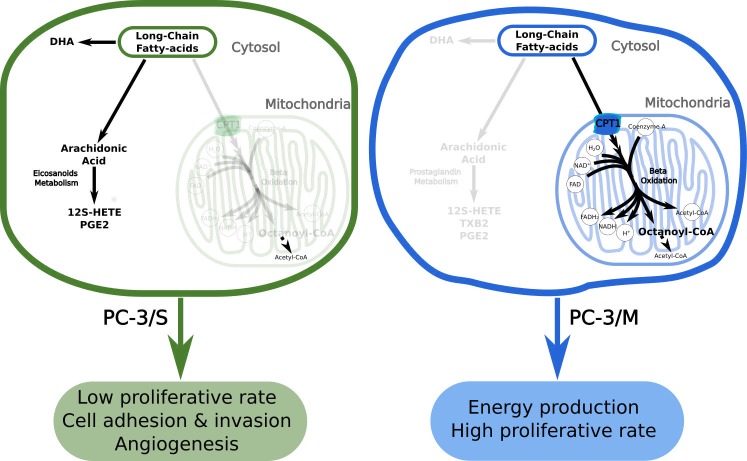
Fig 4. Proposed mechanism of metabolic reprogramming and the resultant phenotypes associated with PC-3/M and PC-3/S cells.
A: Metabolic pathways predominantly active in PC-3/S cells (black solid arrows). Inactive/poorly active pathways are represented as blurred arrows. B: Metabolic pathways predominantly active in PC-3/M cells (black solid arrows). Inactive/poorly active pathways are represented as blurred arrows.

