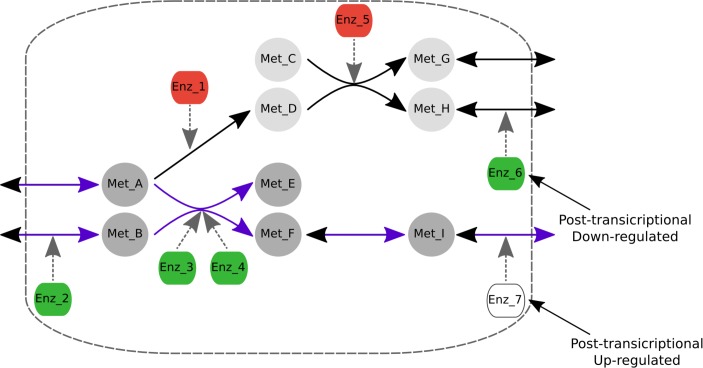
Fig 5. Transcriptomic-based algorithm on a toy metabolic network.
Here the nodes from Met_A to Met_I represents the metabolites involved in this network, the metabolic reactions are represented by continuous arrows, nodes Enz_1 to Enz_7 represent the enzymes that catalyze the metabolic reactions and the discontinuous arrows indicate the enzyme to which each metabolic reaction is associated. The enzymes associated with highly expressed genes are highlighted in green, those associated with lowly expressed genes in red and enzymes associated with moderately expressed genes in white. The algorithm penalizes the use of reactions associated with lowly expressed genes and rewards the use of those associated with highly expressed genes. Thus, based on the expression of the genes associated with this metabolic network, the algorithm predicts that the reactions highlighted in purple will be active while the reactions in black will be inactive. Consequently the metabolite Met_I will be secreted but not Met_G or Met_H.

