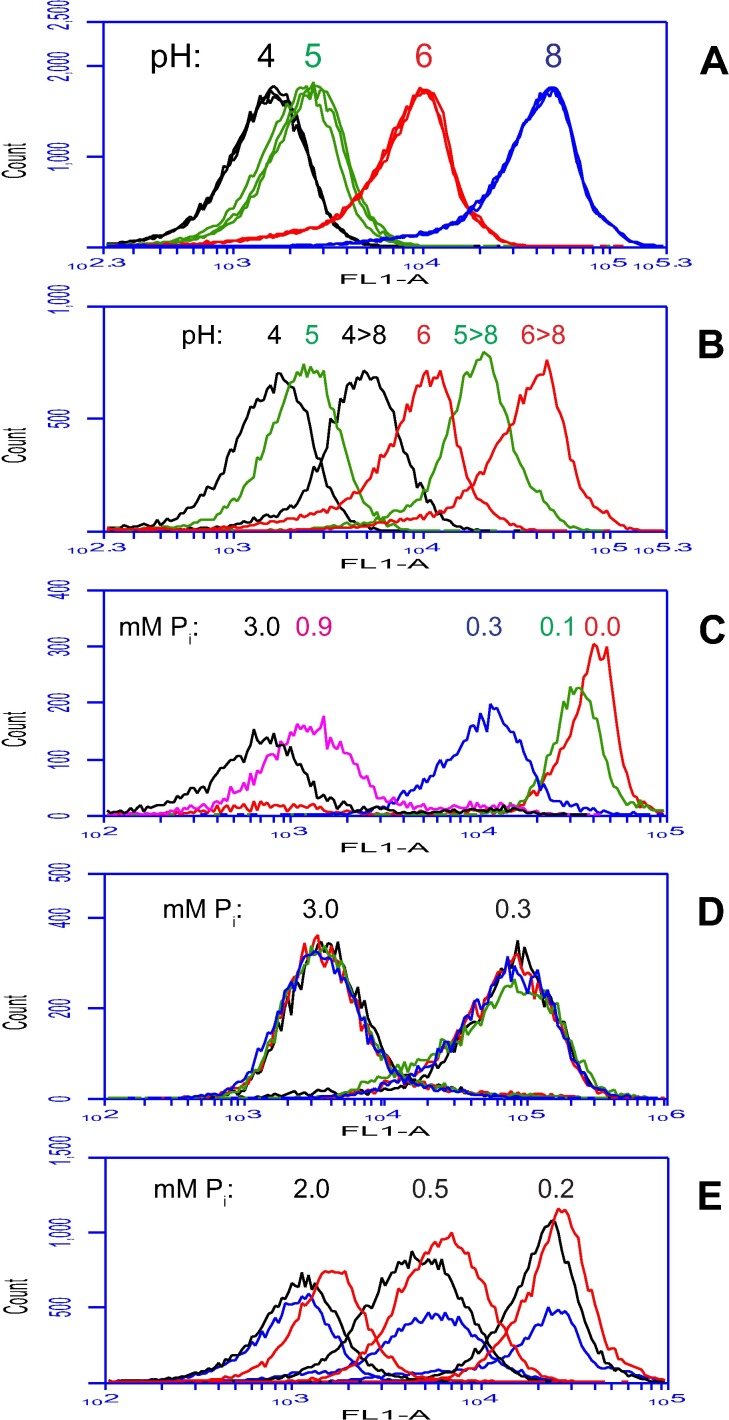
Fig 9. Flow cytometric analysis of strain YGY: Environmental effects on Gfp fluorescence.
(A) Yeast forms were grown on low phosphate BMM13 agarose for 4 days and then dispersed in organic buffers at pH 4, 5, 6 or 8 (each supplemented with 0, 20 or 100 mM NaCl) prior to flow cytometry to measure Gfp fluorescence per cell. (B) Aliquots of the above samples (with the 100 mM NaCl supplement) were alkalinized to pH 8 with Tris buffer and analyzed along with the unalkalinized samples; the pH 8 and pH 8→8 samples coincided exactly with the pH 6→8 sample, and were omitted for clarity. (C) Batch liquid BMM13 yeast cultures were started with different amounts of phosphate (3.0, 0.9, 0.3, 0.1 or 0.0 mM), grown to stationary phase at 30°C, and mixed with 50 volumes of 40% ethanol / 50 mM Tris / 10 mM EDTA (pH 8); expression of YWP1-GFP-YWP1 was enhanced when all of the external phosphate was assimilated (which occurs in BMM13 when the starting concentration is less than 2 mM [22]), resulting in a greater proportion of the population showing induction the sooner the phosphate was depleted. (D) The 3.0 and 0.3 mM phosphate cultures shown in panel C were mixed with 50 volumes of 50 mM Tris / 10 mM EDTA (pH 8; no ethanol) and kept at 23°C, heated to 60°C for 10 min, given 0.5% SDS and kept at 23°C, or given 0.5% SDS and heated to 50°C for 10 min; there was little differential effect on the resulting fluorescence per cell. (E) Cells grown as in panel C with starting phosphate concentrations of 2.0, 0.5 or 0.2 mM were suspended in pH 8 buffer and analyzed live (blue), after heating to 60°C for 15 min (red), or after fixation in 200 mM formaldehyde at 23°C for 90 min (black); the formaldehyde resulted in a slight reduction in fluorescence. Events in panels C and E were gated to eliminate aggregates and multiplets; pre-gate counts (in thousands) were 50 for A and E, 20 for B, and 10 for C and D.

