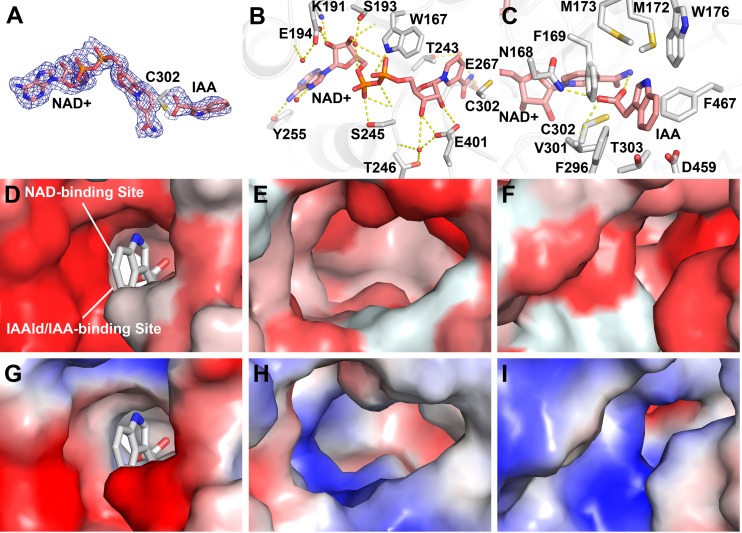
Fig 4. Substrate and cofactor binding sites of AldA.
A) Electron density of NAD+ and IAA. The 2Fo-Fc omit map (1.5 σ) for NAD+ and IAA is shown. B) NAD(H) binding site. Side-chains of residues interacting with NAD+ (rose) are shown as stick-renderings. Waters interacting with the cofactor are shown as red spheres. Hydrogen bonds are indicated by dotted lines. C) IAAld/IAA binding site. NAD+, IAA, and side-chains are shown as stick-renderings with dotted lines indicating hydrogen bonds. D-F) Hydrophobicity of the substrate binding sites of AldA (panel D), AldB (panel E), and AldC (panel F). Homology models of AldB and AldC were generated based on the x-ray structure of AldA. Hydrophobicity was calculated using the Color-h script in PyMol. Darkest red indicates strongest hydrophobicity to white as the most polar. G-I) Electrostatic surface of the substrate binding sites of AldA (panel G), AldB (panel H), and AldC (panel I). Electrostatic surface charge was generated using the APBS plugin in PyMol with red = acidic and blue = basic.

