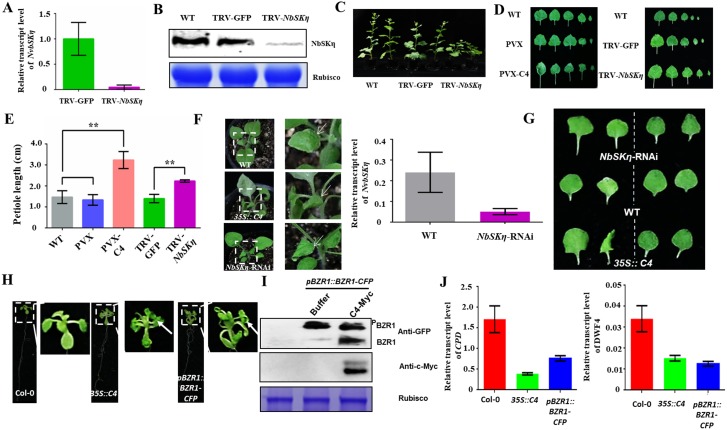
Fig 4. NbSKη-silenced N. benthamiana plants display the phenotype similar to N. benthamiana plants infected by PVX-C4.
(A and B) qRT-PCR (A) and western blot (B) assays of NbSKη gene expression in wild-type (WT) and NbSKη-silenced plants. Relative accumulation level of NbSKη transcripts is normalized against the amount of actin transcript. Error bar denotes the standard deviation of three biological replicates. (C) Growth of the wild-type (WT), mock (TRV-GFP) and NbSKη-silenced (TRV-NbSKη) N. benthamiana plants at 35 dpi. (D) The leaf petioles of NbSKη-silenced N. benthamiana leave mimics that of N. benthamiana leave inoculated with PVX-C4. The phenotype of 1st-5th leaves of plants under different treatments was shown. (E) The petiole length of the 3rd leaf of plants under different treatments. Each treatment had fifteen plants at the same developmental stage. ** represent significant difference (P value <0.01) between treatments tested by t-test. (F) The phenotype of WT, 35S::C4 or NbSKη-RNAi transgenic N. benthamiana plants (left) and qRT-PCR analysis of NbSKη gene expression in WT and NbSKη-RNAi transgenic plants (right). Relative accumulation level of NbSKη transcripts is normalized against the amount of actin transcript. Error bar denotes the standard deviation of three biological replicates. (G) The petiole length of the 2nd (right column) and 3rd (left column) leaves of WT, 35S::C4 transgenic or NbSKη-RNAi transgenic N. benthamiana plants. (H) Images of Col-0, pBZR1::BZR-CFP (BZR1 overexpression A. thaliana) or 35S::TLCYnV C4 transgenic A. thaliana. Arrowheads indicate the downward leaf curling of the leaves. (I) Western blot analysis of BZR1-CFP phosphorylation level. The presence of TLCYnV C4 could decrease the level of phosphorylated BZR1-CFP. BZR1-CFP was detected using a monoclonal antibody against GFP. C4-Myc was detected using a monoclonal antibody against Myc. BZR1-CFP and phosphorylated BZR1-CFP were designated as BZR1 and PBZR1, respectively. (J) Quantitative PCR analysis of relative expression levels of BZR1-targeted genes (CPD and DWF4) in Col-0, 35S::C4 transgenic or pBZR1::BZR1-CFP transgenic A. thaliana.

