
Figure 1.
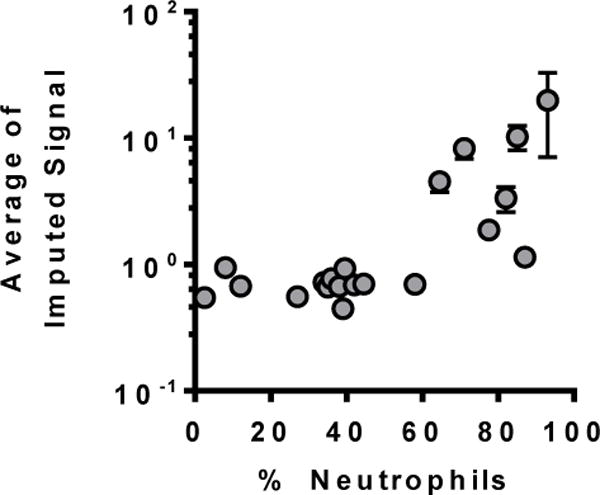
Average MS metabolomics signal in BALF from 20 preschool children with CF plotted relative to % neutrophils on cell counts from these samples. Samples with >60% neutrophils had more overall MS signal.
Official websites use .gov
A
.gov website belongs to an official
government organization in the United States.
Secure .gov websites use HTTPS
A lock (
) or https:// means you've safely
connected to the .gov website. Share sensitive
information only on official, secure websites.
Average MS metabolomics signal in BALF from 20 preschool children with CF plotted relative to % neutrophils on cell counts from these samples. Samples with >60% neutrophils had more overall MS signal.