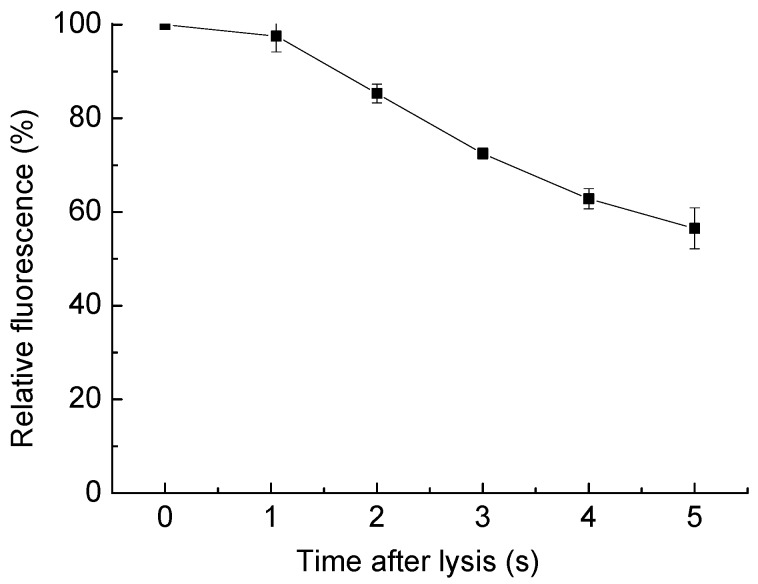
Figure 7.
Dilution of cell content as the time passed after cell lysis. Relative fluorescence is measured as the integrated fluorescent density compared with it before the cell lysis, in a 100 µm × 100 µm area surrounding the targeted cell, with the background subtracted. Since the cell interior was stained with Calcein AM, the fluorescence change represents the dilution of cell content. The data is from three parallel tests, and error bars show the standard error of the measurements.

