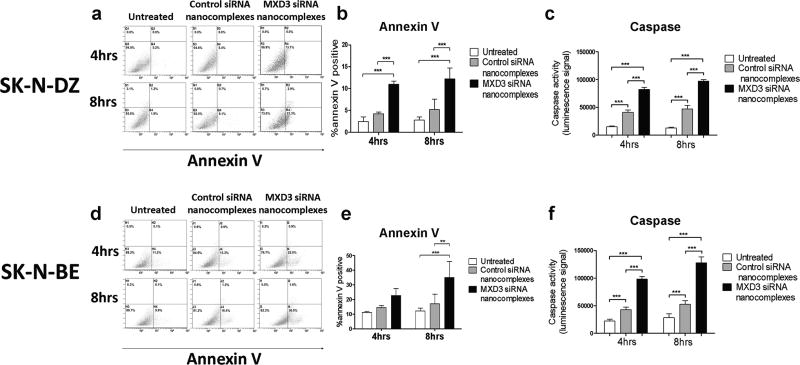
Figure 4. Treatment with the MXD3 siRNA nanocomplexes increases apoptosis in the SK-N-DZ and SK-N-BE cells.
SK-N-DZ (a–c) or SK-N-BE (D–F) cells treated with the MXD3 siRNA nanocomplexes were more annexin V or caspase positive than untreated cells or cells treated with the control siRNA nanocomplexes at both 4 and 8 hours after treatment. (a and d) Flow cytometry graphs are shown from one representative experiment out of 3 independent experiments. (b and e) quantification of annexin V positive cells from 3 experiments. Data as mean ± SD. n = 3 for each time point. (b) Untreated or control siRNA nanocomplexes vs. MXD3 siRNA nanocomplexes at both time points (***) p<0.001. (e) Untreated vs. MXD3 siRNA nanocomplexes at 8 hours (***) p<0.001. Control vs. MXD3 siRNA nanocomplexes at 8 hours (**) p<0.01. (c and f) Cell apoptosis measured by caspase 3 and 7 activities are shown. Data include 3 independent experiments. Data as mean ± SD. n = 9 for each time point. (c) Untreated vs. control or MXD3 siRNA nanocomplexes, and control vs. MXD3 siRNA nanocomplexes, at both time points (***) p<0.001. (f) Untreated vs. control or MXD3 siRNA nanocomplexes, and control vs. MXD3 siRNA nanocomplexes, at both time points (***) p<0.001.

