
Figure 11. The nociceptin dependent upregulation of GLAST is also mediated by mTOR and JAK signaling complexes.
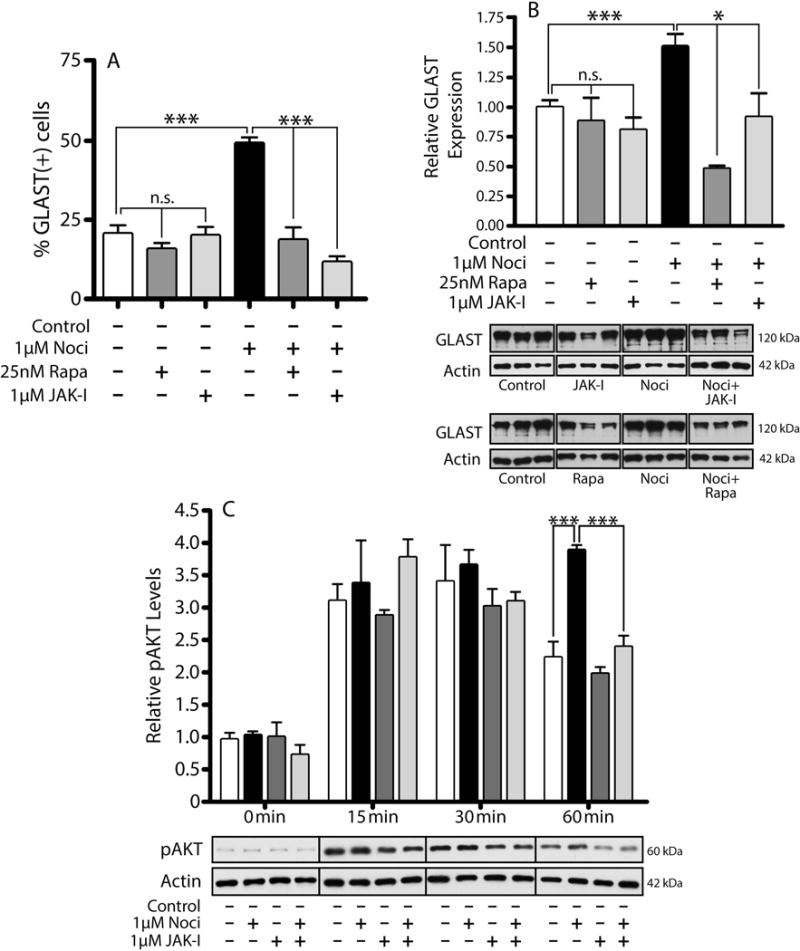
(A) Immunocytochemistry was used to evaluate GLAST expression in rat astrocytes after a 24 hr incubation in CDM alone, or CDM supplemented with one of the following: 25nM Rapamycin (Rapa), 1μM JAK Inhibitor I (JAK-I), 1μM Noci, 1μM Noci + 25nM Rapa, or 1μM Noci + 1μM JAK-I. The bar graph shows the number of GLAST positive cells as a % of the GFAP(+) cells/field under each condition. Results are the mean ± SEM from twelve fields/well, 3 wells/condition. Control vs. Rapa and JAK-I, n.s.; control vs. Noci ***p<0.001; Noci vs. Noci + Rapa and Noci + JAK-I, ***p<0.001. (B) Astrocytes treated for 24 hrs in the conditions listed above, were subjected to western blot analysis for GLAST. GLAST levels in the bar graph are expressed as change relative to control values. The results are the mean ± SEM, n=3. Control vs. Rapa and JAK-I, n.s.; control vs. Noci ***p<0.001; Noci vs. Noci + Rapa and Noci + JAK-I, *p<0.05. (C) Astrocyte cultures were first pre-incubated for 2 hrs in DMEM-F12 alone; and then for increasing times (0-60 min) in CDM alone, CDM + 1μM Noci, CDM + 1μM JAK-I, or CDM + 1μM Noci + 1μM JAK-I. Cell lysates were then subjected to western blot analysis for pAKT. The results are expressed as change relative to control and are the mean ± SEM from 3 different cultures; control vs. Noci at 60 min, ***p<0.001; controls vs. JAK-I, n.s.; Noci vs. Noci + JAK-I, ***p<0.001.