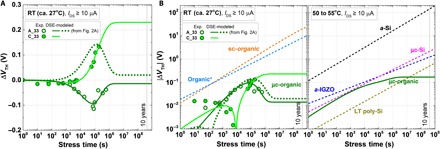
Fig. 3. Long-term stability comparison in different TFT technologies.

(A) RT measured ΔVTH under on-state bias stress tests of A_33 and C_33 at VDS = VGS = −10 V with fitted curves using a DSE model. (B) Left: RT measured |ΔVTH| under on-state bias stress tests of A_33 and C_33 at VDS = VGS = −10 V with fitted curves from (A). ”*” represents the blue dashed data that are from the state-of-the-art OTFT showing the highest stability by using IDTBT with F4TCNQ molecular additives (19). The orange dashed data are from the sc-organic FET with remarkable stability (14). Right: Comparison between DSE-modeled |ΔVTH| at 55°C for μc-OTFTs and SSE-modeled |ΔVTH| at 50°C for commercial TFT technologies (26).
