
Figure 1. A decreased rate of hepatic glycogenolysis is the primary determinant of the switch from glucose to fat oxidation during starvation.
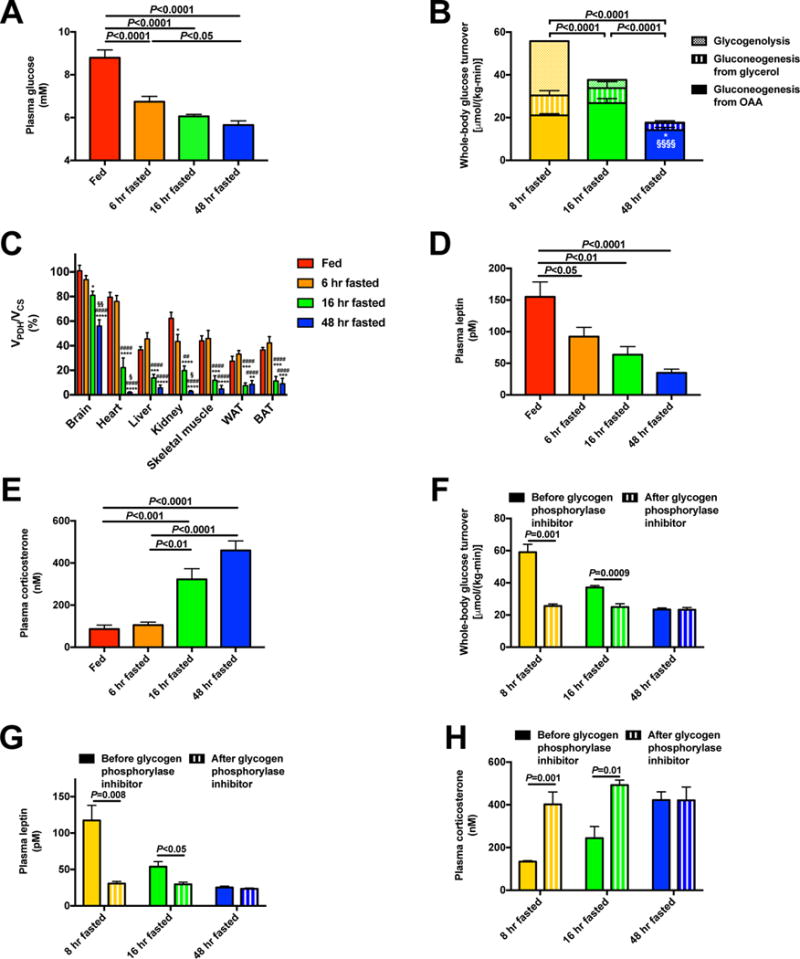
(A) Plasma glucose. (B) Hepatic glucose production from net hepatic glycogenolysis, gluconeogenesis from oxaloacetate (i.e. VPC), and gluconeogenesis from glycerol. *P<0.05 vs. 8 hr fasted rats and §§§§P<0.0001 vs. 16 hr fasted rats, in both cases comparing gluconeogenesis from oxaloacetate. (C) Percent glucose oxidation in the TCA cycle [pyruvate dehydrogenase flux (VPDH)/citrate synthase flux (VCS)]. *P<0.05, **P<0.01, ***P<0.001, ****P<0.0001 vs. fed rats; ####P<0.0001 vs. 6 hr fasted rats, §P<0.05, §§P<0.01 vs. 16 hr fasted rats. (D)–(E) Plasma leptin and corticosterone. (F) Endogenous glucose production before and 2 hrs after treatment with a glycogen phosphorylase inhibitor. (G)–(H) Plasma leptin and corticosterone in glycogen phosphorylase inhibitor-treated rats. In panels (F)–(H), data from the same rats before and after treatment with the inhibitor were compared by the paired Student’s t-test; in all other panels, ANOVA with Bonferroni’s multiple comparisons test was used. Data are the mean±S.E.M. of n=6–8 per group. See also Fig. S1 and S2.