
Figure 3. Increased hepatic acetyl-CoA content maintains euglycemia during starvation.
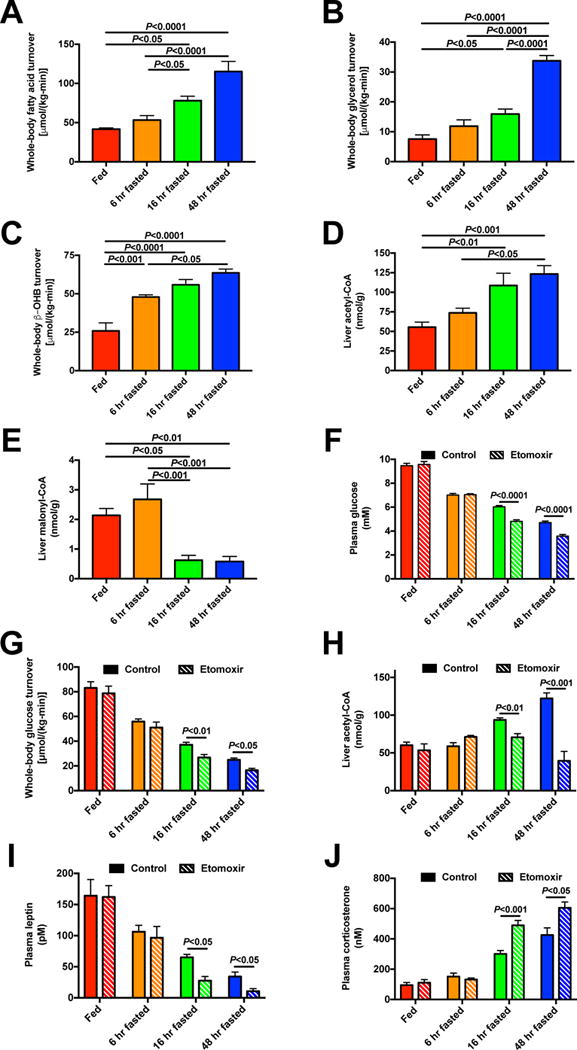
(A)–(C) Whole-body fatty acid, glycerol, and β-OHB turnover. (D)–(E) Hepatic acetyl- and malonyl-CoA content. In panels (A)-(E), n=7 per time point, and data were compared by ANOVA with Bonferroni’s multiple comparisons test. (F)–(G) Plasma glucose and whole-body glucose turnover 2 hr after treatment with etomoxir. (H) Liver acetyl-CoA content. (I)–(J) Plasma leptin and corticosterone concentrations. In panels (F)–(J), data are the mean±S.E.M. of n=6 per group. Data were compared by ANOVA with Bonferroni’s multiple comparisons test (control vs. etomoxir vs. atglistatin, with these groups compared separately at each time point; control data are duplicated between Fig. 3 and Fig. 4). See also Fig. S4.