
Figure 6. Infection and transmission rates of singly and dually infected Cx. tarsalis.
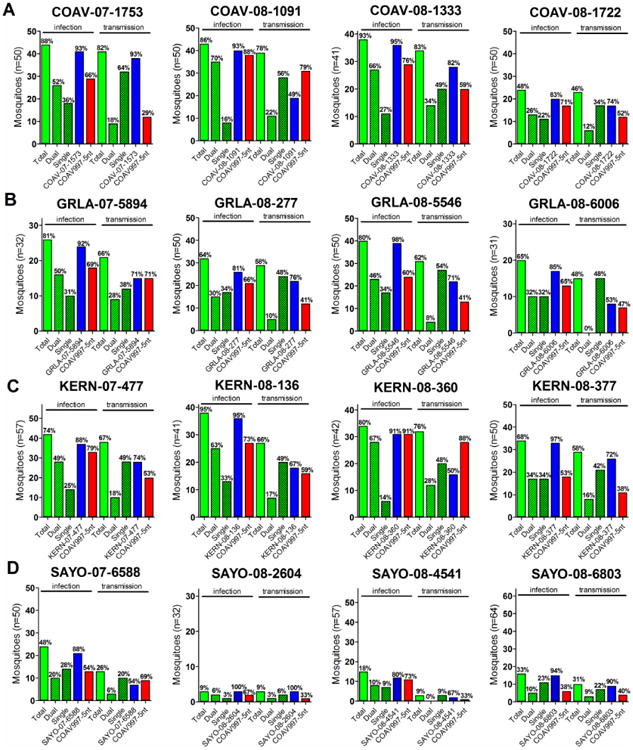
Total infection rates (green bars) were calculated based on the number of all bodies that tested positive by qRT-PCR over all blood fed mosquitoes surviving to 14 dpi (n). Similarly, total transmission rates (green bars) were determined based on expectorants with detectable viral RNA over all qRT-PCR positive bodies. Additionally, total infection and transmission rates were split to reflect single (green dotted bars) and dual (green striped bars) infections. Virus-specific infection and transmission rates are shown for wildtype isolates (blue bars) and COAV997-5nt (red bars) determined from all qRT-PCR positive bodies and expectorants, respectively. Transmission results were derived from expectorants passaged in Vero cells.