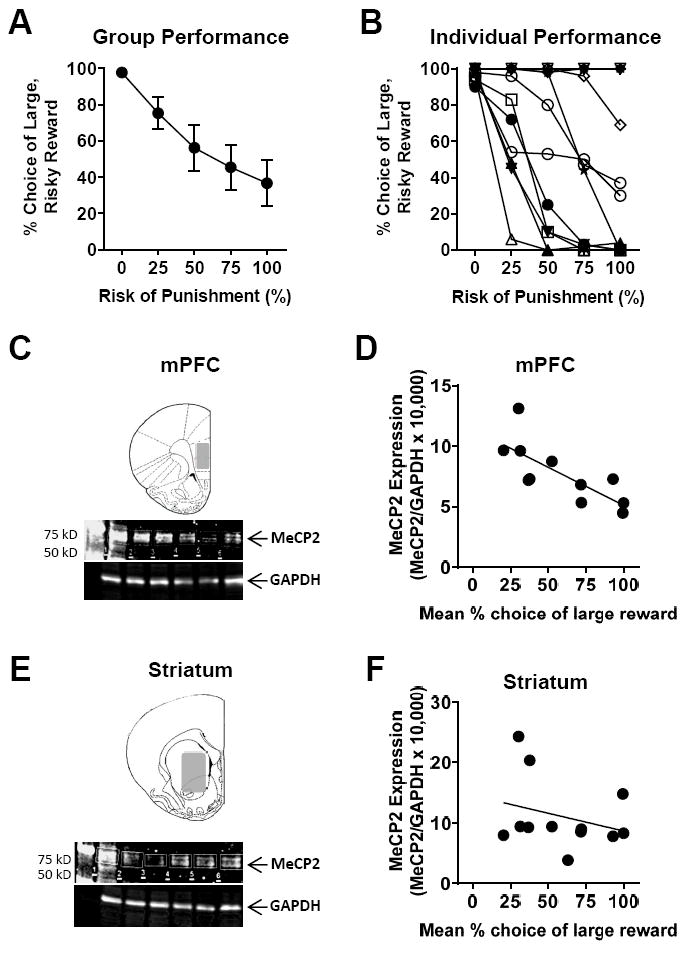
Figure 1. MeCP2 expression in the medial prefrontal cortex correlates with RDT performance.

A, B. Stable behavioral performance in the RDT (mean % choice of the large, risky reward, n=12). A. Group mean performance (± standard error of the mean). B. Performance of each rat in the group (each line represents data from a single rat). C, E. Western blot for MeCP2 and GAPDH expression using tissue collected from mPFC (C) and striatum (E) as indicated in the shaded areas of each schematic. D, F. Scatterplots show individual mean percent choice of large, risky reward vs. MeCP2 expression (MeCP2/GAPDH x 10,000). There was a significant negative correlation between choice of the large, risky reward and MeCP2 expression in the mPFC (D; n=11), but not in the striatum (F; n=12).
