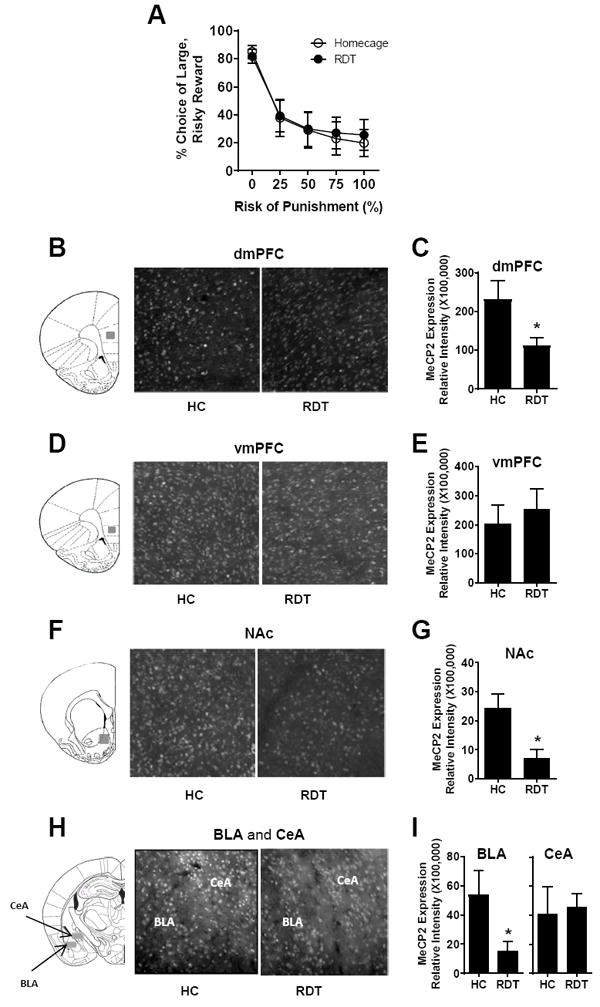
Figure 2. MeCP2 expression in the mPFC, NAc, and amygdala after acute RDT testing.

A. Both RDT (n=12) and home cage (HC; n=12) control groups decreased their choice of the large, risky reward as the risk of punishment increased across the session. Graph represents mean % choice of the large, risky reward. B, D, F, H. Tissue sections across dorsal medial prefrontal cortex (dmPFC), ventral medial prefrontal cortex (vmPFC), nucleus accumbens (NAc), basolateral amygadala (BLA) and central amygdala (CeA), respectively, were processed with immunohistochemistry to evaluate MeCP2 expression in the regions indicated by gray shaded areas in the coronal section schematics (Paxinos and Watson, 2007). C, E, G, I. Quantification of MeCP2 expression in the dmPFC (n=10,10), vmPFC (n=12,12), NAc (n=9,9), BLA (n=10,10) and CeA (n=8,8), respectively, as represented by relative fluorescence intensity. * denotes p<0.05, RDT group compared to HC group. Error bars represent standard error of the mean.
