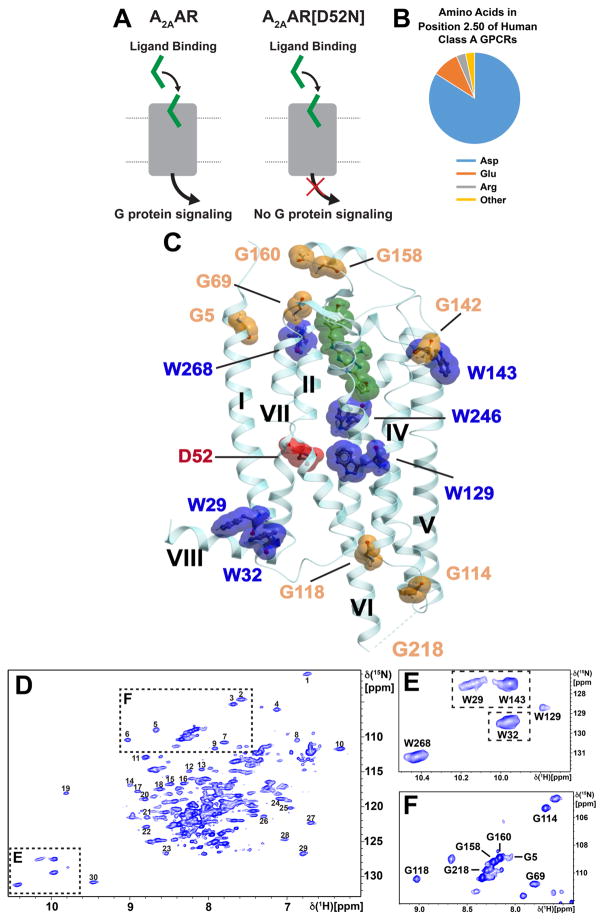
Figure 1. A2AAR Signaling via an Allosteric Center at Asp522.50 Probed by an Extensive Network of Assigned NMR Signals.
(A) Scheme of agonist-induced signaling in A2AAR and A2AAR[D52N], i.e., receptors with and without an active allosteric switch at position 522.50, respectively. The gray shape represents A2AAR, the green shape the signal-inducing drug, and the upper and lower thin horizontal lines indicate the extracellular and intracellular membrane surfaces, respectively. (B) Pie chart showing the frequency of amino acid types occurring at position 522.50 in all class A GPCRs: Asp 84%, Glu 10%, Arg and others 6% (Munk et al., 2016). (C) Ribbon representation of the crystal structure of the antagonist ZM241385 (green) complex of A2AAR expressed in Pichia pastoris (PDB 6AQF). The location of the fusion protein BRIL in the intracellular loop 3 (ICL3), where G218 was eliminated in the fusion protein, is indicated by a thin broken line; G218 was left intact in the A2AAR sequence used for NMR studies (see Figure S1 for the location of G218 at the intracellular tip of trans-membrane helix VI in a structure without fusion protein). NMR-assigned tryptophan residues and their sequence positions are highlighted in blue, assigned glycine residues are orange, and the residue Asp522.50 is shown in red. (D) 2D [15N,1H]-TROSY correlation spectrum of A2AAR in complex with ZM241385. Dashed boxes highlight the Trp indole 15N–1H and Gly backbone 15N–1H regions, which are shown on expanded scales in (E) and (F), respectively, with sequence-specific assignments indicated next to the signals. The peaks numbered 1 to 30 were used to monitor the global folds of the A2AAR variants used here for resonance assignments and function-related studies.

