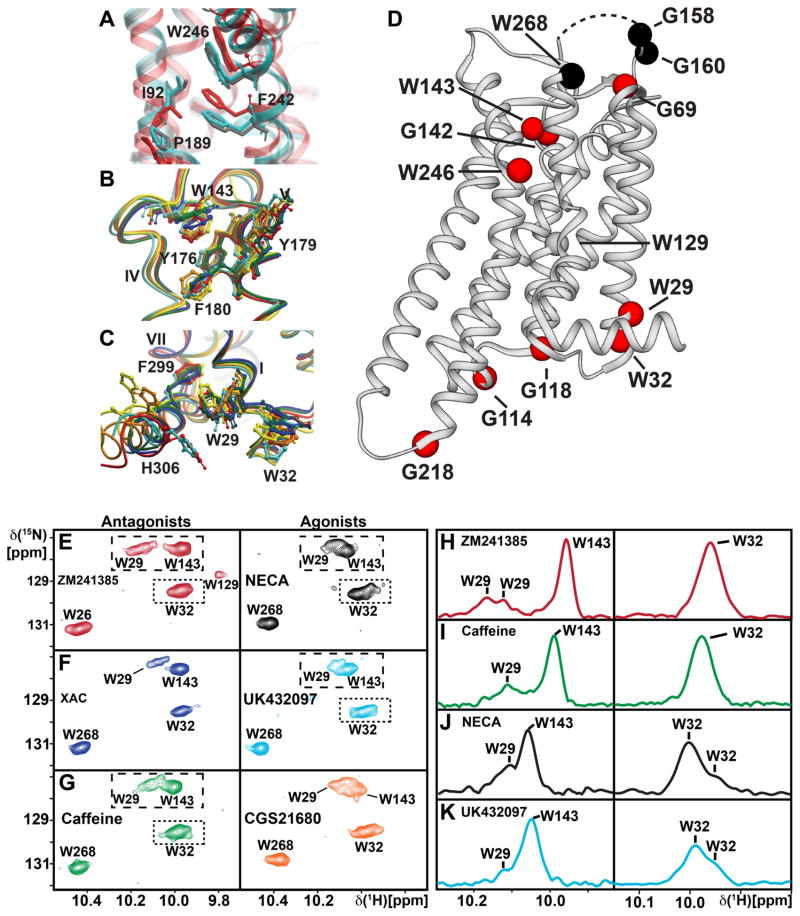
Figure 4. Local Environments of Selected Trp Residues in Crystal Structures of A2AAR and Response of Trp Indole 15N–1H NMR Lines to Variable Efficacy of Bound Drugs.
(A) Global superposition of the environment of Trp2466.48 in the crystal structures of A2AAR complexes with ZM241385 (red; PDB 3EML) and UK432097 (silver-blue; PDB 3QAK), and the ternary complex with NECA and a “mini-Gs” protein (grey; PDB 5G53). Trp2466.48 and the nearby residues F2426.44, I923.40 and P1895.50 are labeled and shown in stick representation. (B and C) Environment of two Trp residues in the A2AAR complexes with six different ligands (Figure 3E), i.e., ZM241385 (red; PDB 3EML), CGS21680 (orange; PDB 4UHR), UK432097 (silver-blue, PDB 3QAK), NECA (yellow; PDB 2YDV), caffeine (green; PDB 3PWH) and XAC (blue; PDB 3REY). Global superpositions of the crystal structures are shown, with ribbon representations of the backbone and stick representations of aromatic residues of interest. (B) Trp143. (C) Trp291.55. These structures were used to calculate the ring current shifts in Table S1. (D) Survey of the response of NMR probes in A2AAR to drug efficacy. Assigned Gly and Trp residues are shown as spheres positioned in the structure of the A2AAR-ZM241385 complex (PDB 3PWH). Red spheres indicate that a response was observed, either by different chemical shifts, variation of the signal line shapes, or both. Black spheres indicate that there was no response. The curved dashed line at the top of the receptor indicates the position of ECL2, which was not observed in the crystal structure. (E) – (G) Contour plots of the tryptophan indole 15N–1H region of 2D [15N,1H]-TROSY correlation spectra of [u-15N,~70% 2H]-A2AAR bound to ligands with different efficacies, as identified in each panel. Complexes with antagonists are in the left column and those with agonists on the right. Colors of the spectra correspond to the colors of the corresponding crystal structures of A2AAR–ligand complexes in panels (B) and (C). (H) – (K) Projections of the contents of the boxes in the corresponding contour plots along the 15N chemical shift axis onto the lower boundary of the boxes. The same colors are used as for the contour plots and peak assignments are indicated.

