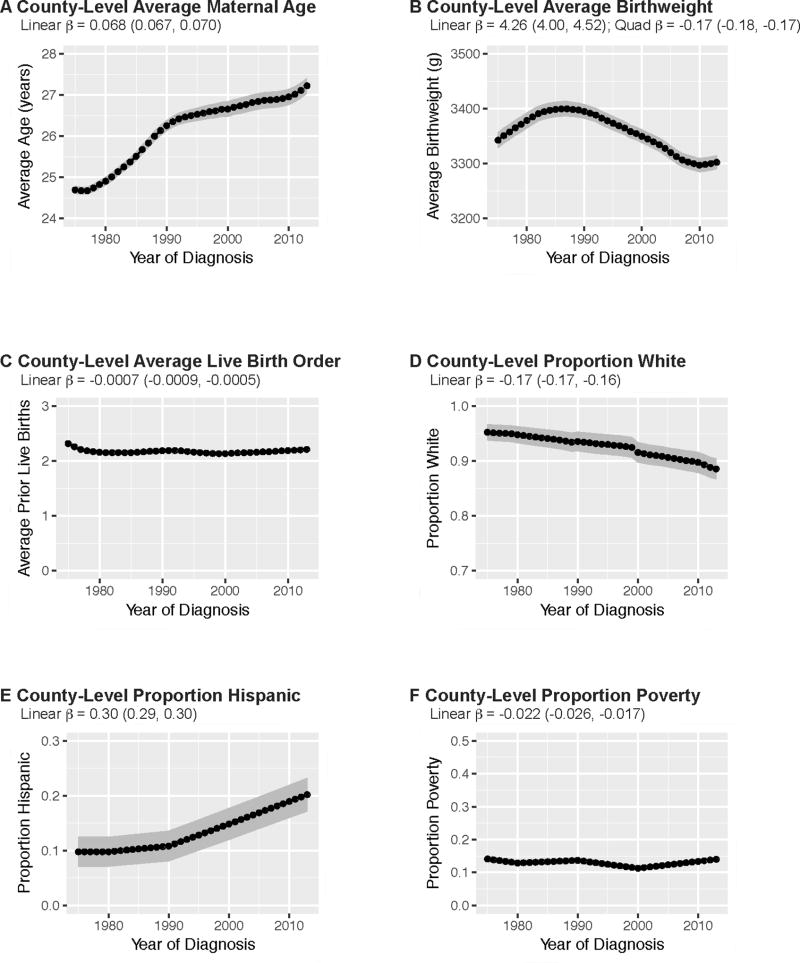
FIGURE 1.
Temporal trends in county-level pregnancy and sociodemographic characteristics, SEER 9 counties (N=194), 1975–2013. Annual county-level estimates are averaged across the sample of 194 counties (i.e. points represent the annual average of count-level averages/proportions). Linear and quadratic time trends estimated from linear mixed models specifying year of diagnosis predicting the specified county-level characteristic. Birthweight measured in grams (g). County-level proportion white and proportion Hispanic refer to the childhood population, ages 0 to 4 years, within counties. County-level proportion poverty refers to the proportion of individuals, all ages, within counties classified as below the federal poverty line.

