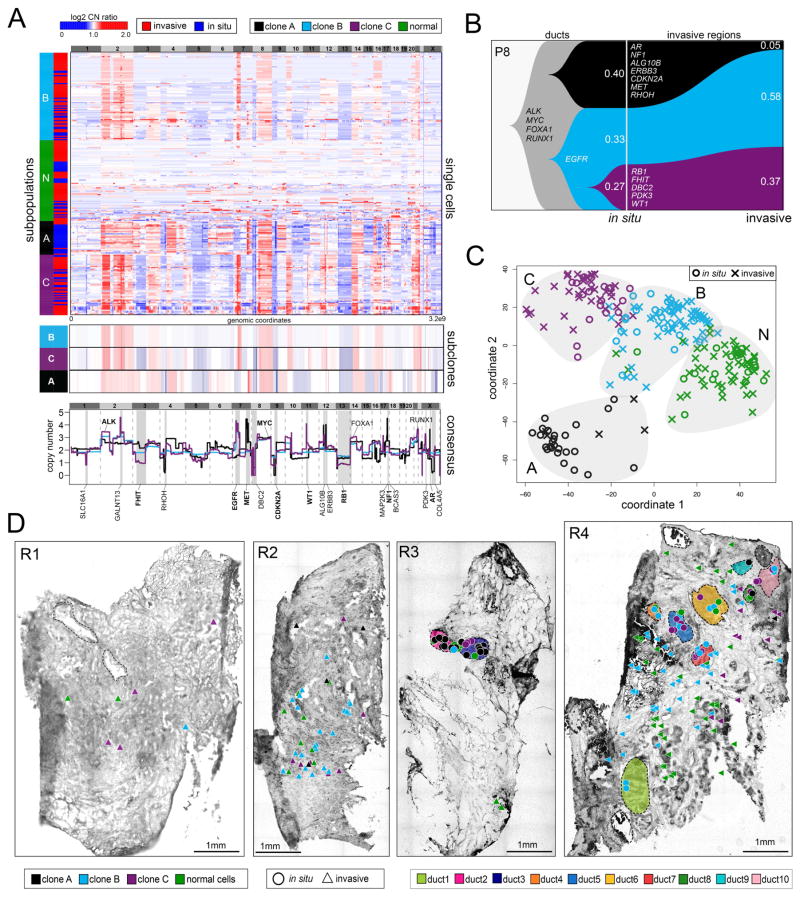
Figure 2. Single Cell Copy Number Profiling in Patient P8.
(A) Clustered heatmap of single cell copy number profiles with headers indicating the major subpopulations and tissue regions (in situ or invasive) from which the cells were isolated. Lower panels show consensus profiles of the major clonal subpopulations, with known cancer gene annotations for common CNAs listed above and divergent CNAs listed below. (B) Clonal lineages of the major tumor subpopulations plotted with Timescape with inferred common ancestors indicated in grey, and clonal frequencies labelled. (C) MDS plot of single cell copy number profiles with in situ or invasive regions indicated. (D) Spatial maps of tissue sections from four different tumor regions, with single cells marked as in situ or invasive. Tumor cells are color coded by their clonal genotypes or by diploid genomes, and ducts are annotated with different colors.

