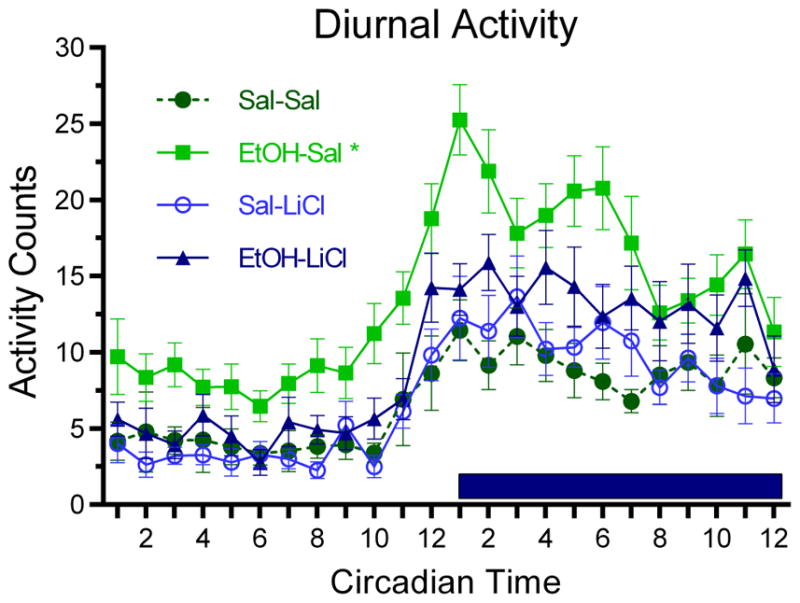
Figure 3.

P7 ethanol induced behavioral hyperactivity in the home cage compared to all other groups. Activity is quantified in arbitrary units by the DSI telemetry implant; mean hourly activity +/− SEM is indicated on the y-axis. This hyperactivity was present during both the light and dark phases of the diurnal cycle; dark phase is indicated by the dark bar. Co-treatment with LiCl prevented this behavioral hyperactivity. Asterisk signifies a main group effect with EtOH-Sal being significantly different from all other groups.
