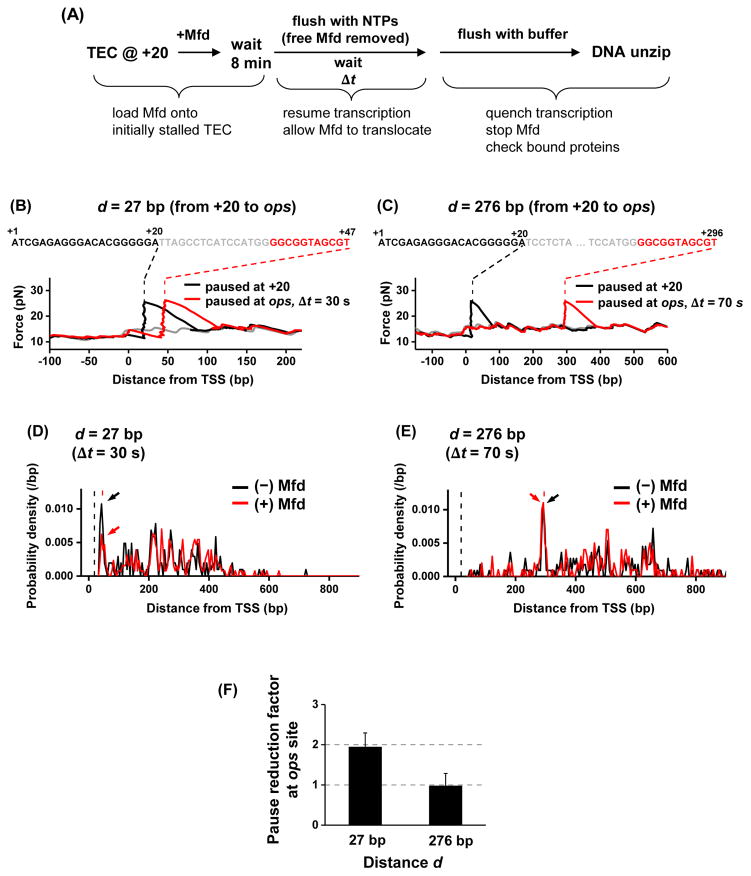
Figure 3. Mfd catching up to a TEC at an ops pause site.
(A) Experimental scheme. The experimental steps are similar to those of Figure 2B. Instead of a subsequent stall, RNAP could transiently pause at the ops site.
(B) and (C). Representative traces of transcription on two different templates, with the separation of the ops site from the initial +20 site being d = 27 bp and 276 bp, respectively. The black and red dashed lines indicate stall position at +20 and the expected ops pause position respectively.
(D) and (E). Probability density functions of TEC location. Plots were generated by pooling data from multiple traces of TEC location data: N = 205 and 255 for (−) and (+) Mfd respectively for d = 27 bp; N = 201 and 188 for (−) and (+) Mfd respectively for d = 276 bp. Only the TECs that had escaped from +20 were considered in these histograms. Arrows point to the peaks of TEC paused at the ops site. The vertical black and red dashed lines indicate the initial stall position at +20 and the expected ops pause position, respectively. See also Figure S3D.
(F) Pause reduction factor at the ops site, defined as the ratio of the ops peak area without Mfd preloading over that with Mfd preloading in (D) and (E). Error bars were calculated assuming a binomial distribution for the fraction of TEC paused at the ops site.

