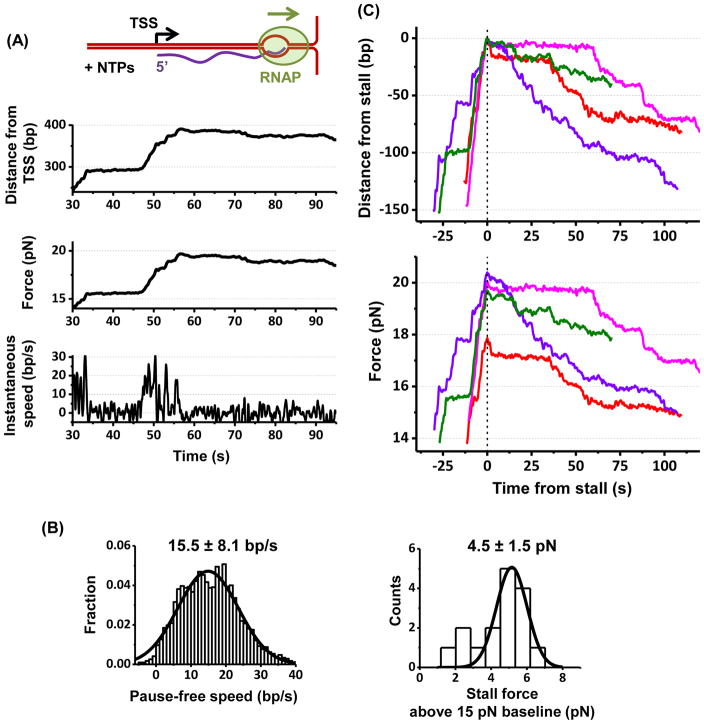
Figure 4. TEC working against a DNA fork.
(A) A representative trace of a TEC working against a DNA fork. See also Figure S4A.
(B) Histograms of the pause-free speed of TEC prior to stalling and the stall force. For each histogram, its mean and SD are indicated with the number of traces N = 16.
(C) TEC backtracking at a stall. In order to highlight backtracking, multiple traces, each with a different color, are shown. All traces are aligned with respect to the start of stall time and position. Bottom figure shows corresponding force.

