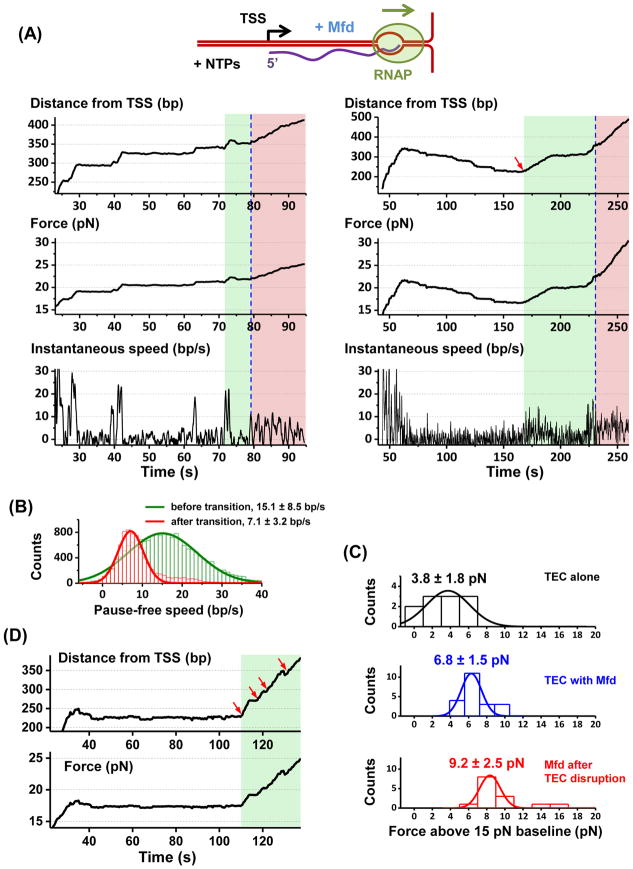
Figure 5. TEC working against a DNA fork in the presence of Mfd.
(A) Two representative traces. The left trace is an example of prevention of extensive backtracking and the right an example of backtracking recovery. Blue dashed lines indicate transitions between Mfd facilitated transcription (green shaded areas) and Mfd terminated transcription (pink shaded areas). The start of a green shaded area was determined at when the force increased beyond that of the TEC alone as in the left panel, or at when a clear backtracking recovery was detected as in the right panel (also indicated by a red arrow). Within a green region, the instantaneous speed was consistent with that of a TEC (except during backtracking recovery). Within a pink region, the instantaneous speed was consistent with that of Mfd or Mfd with a non-elongating RNAP. See also Figure S6.
(B) Pause-free speed histograms before and after the transition from transcription elongation to transcription termination. Gaussian fits to these histograms are also shown along with the means and SDs of the fits. Number of traces used in both histograms: N = 23.
(C) Histograms of measured forces. The top histogram shows the stall force when no backtracking recovery was detected (TEC only). The middle histogram shows the force at the transition from transcription elongation to termination (TEC with the help of Mfd). The bottom histogram shows the stall force after the transition (Mfd with RNAP). The mean values and SDs are also indicated.
(D) An example trace showing multiple rounds of interactions of Mfd with a TEC. Each red arrow indicates a rescue event where a paused/stalled TEC was brought into active elongation by Mfd.

