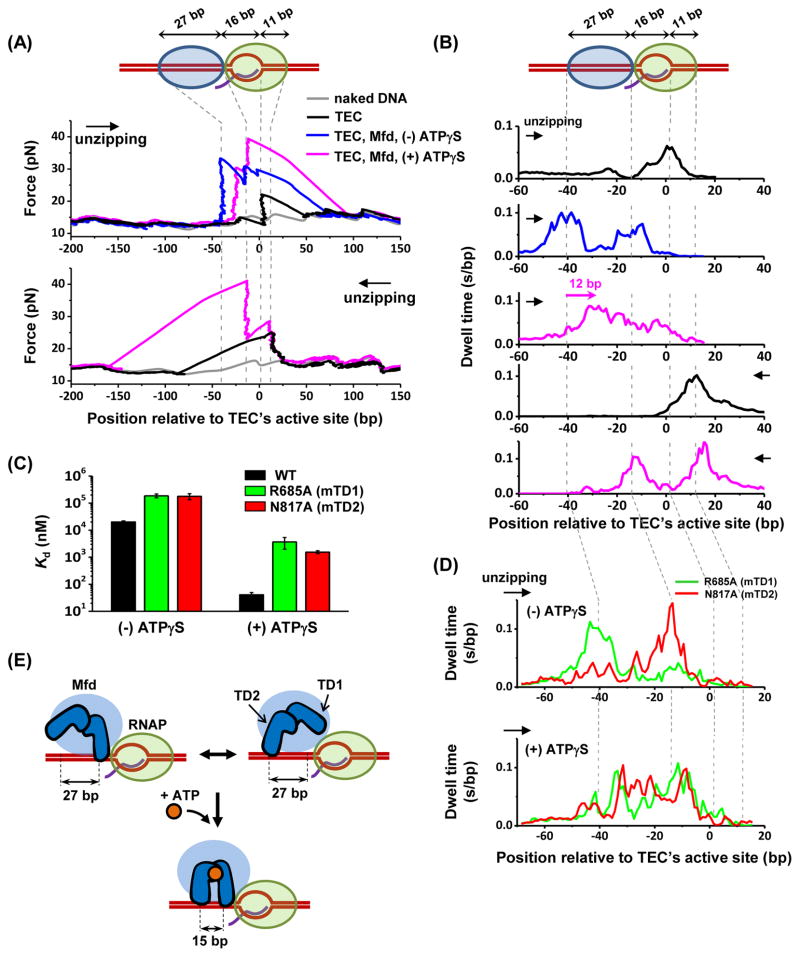
Figure 6. Structural mapping of Mfd-TEC interactions.
(A) Example unzipping traces. A TEC was stalled at +20 position and each unzipping direction is indicated by an arrow. Vertical dashed lines indicate the positions of measured strong interactions. See also Figures S7A and S7B.
(B) Dwell-time histograms after pooling data from multiple traces. Total number of traces in each histogram (from top to bottom) are N = 132, 63, 73, 160, and 65. For dwell-time histograms in the presence of Mfd, only traces with an additional force rise upstream of the TEC, indicative of Mfd binding to TEC, were included for analysis. The pink arrow indicates a forward shift in the footprint of Mfd towards the TEC in the presence of ATPγS. (C) Dissociation constant Kd of the wild type Mfd as well as MfdR685A and MfdN817A for binding to TEC (STAR Methods). Error bars are SEMs.
(D) Dwell-time histograms of MfdR685A (green) and MfdN817A (red) in the absence (top) or presence (bottom) of 2 mM ATPγS. Number of traces for each histogram are 27 and 21 for MfdR685A and MfdN817A respectively in the absence of ATPγS, and 25 and 30 for MfdR685A and MfdN817A respectively in the presence of ATPγS.
(E) Proposed model of the cooperation of the two translocation domains of Mfd upon binding to nucleotide. See also Figure S7D.

