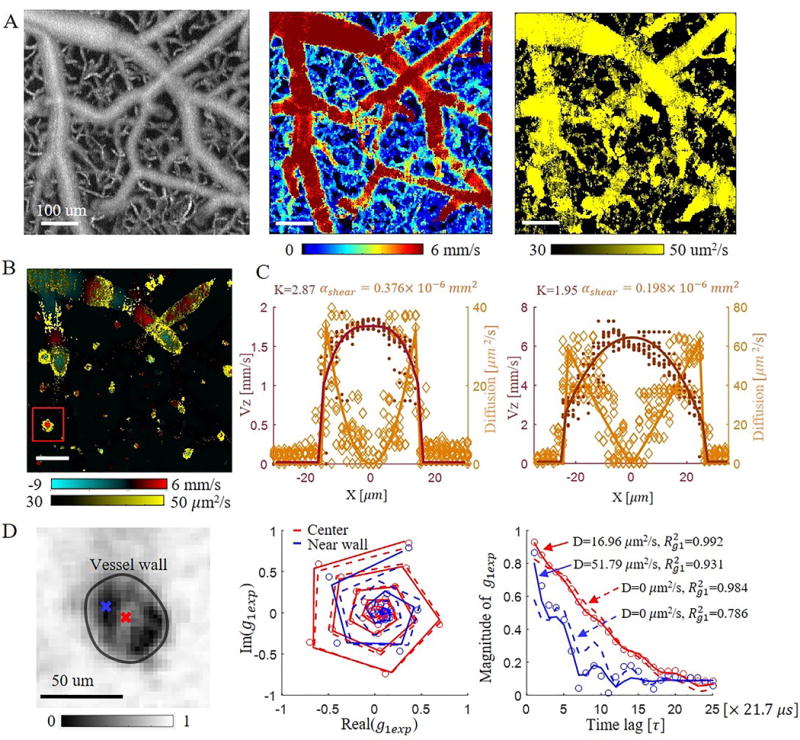
Figure 2.

Representative DLS-OCT result. (A) Maximum Intensity Projection (MIPs) of an OCT angiogram (left), total blood flow velocity (middle), and diffusion coefficient (right) over 0–350 μm in depth. Scale bar, 100 μm. (B) En face single plane axial velocity overlapped with diffusion coefficient at a depth of 100 . Scale bar, 100 μm. (C) Axial blood flow profile and diffusion coefficient profile of ascending venules with a vessel diameter of 31 (left) and 51 (right). Solid lines are the fitted laminar blood flow profile and diffusion coefficient profile of the averaged and D along 10 profiles for each vessel section. Dark-red dots and orange diamonds represent the measured RBC velocity and diffusion coefficient along all 10 profiles, respectively. (D) Left: Experimental autocorrelation function ( ) map at the 10th time lag for the ascending venule marked in (B); middle: complex plane autocorrelation function curve at the center (red) and near wall (blue) positions within the vessel; right: magnitude change of versus time lag for the center (red) and near wall (blue) positions. Red and blue circles are the experimental . Solid curves are the fitted results when considering both convective and diffusive motions of RBCs. The dashed curves illustrate the fitted results when only considering convective motion of RBCs (diffusion coefficient was set to 0). is the coefficient of determination, representing fitting accuracy.
