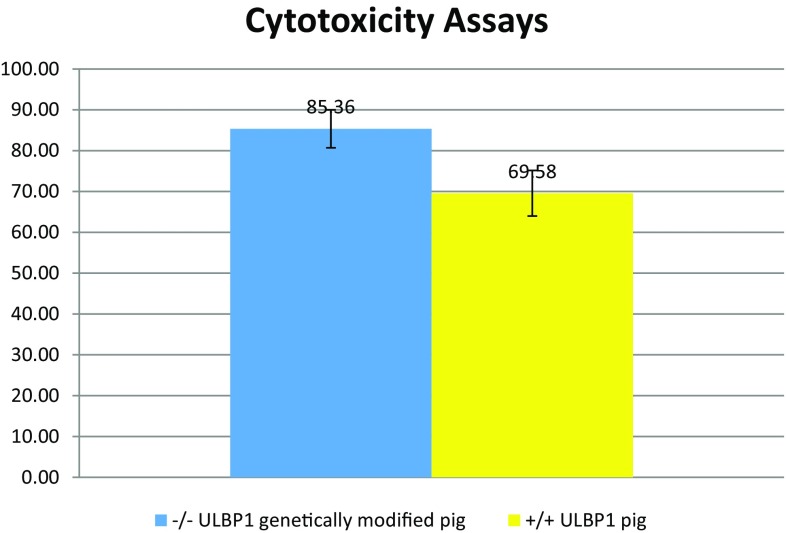
Fig. 2.
Survival rate analysis for cells from −/− ULBP1 pig #184 (blue) and +/+ ULBP1 pig (yellow) in the medium with human NK cells. The human NK cells (effector cells) were added to endothelial cells (target cells) in an E:T ratio 5:1. After co-culture for 4 h, CCK-8 was used to detect the remaining vital cells. The survival rate was measured by the average number of living cells. The percentage of surviving cells in each tested group was marked on Y-axis. Means were compared by Welch two-sample t test (p value = 0.0565)

