Figure 4.
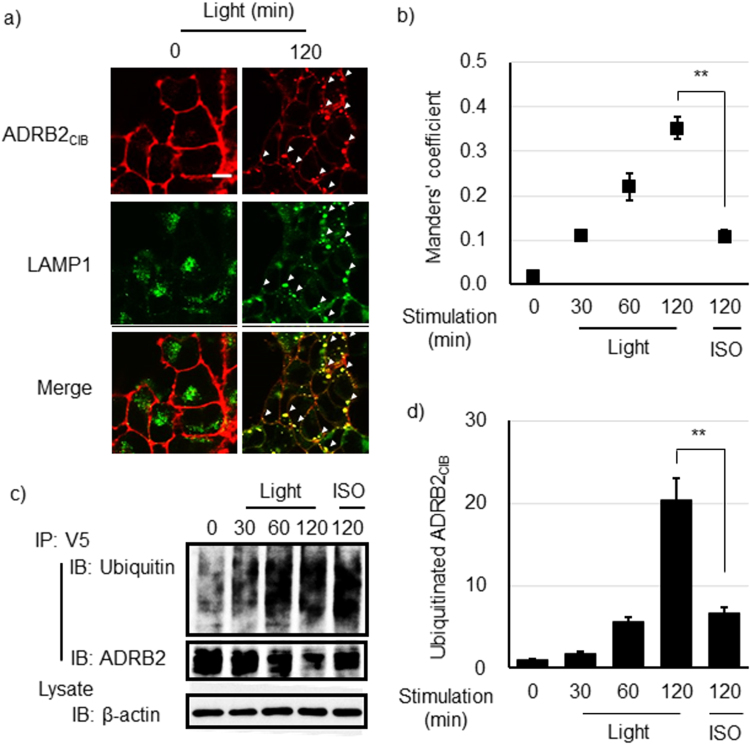
Lysosome sorting of ADRB2CIB after prolonged irradiation. (a) Images of ADRB2CIB and lysosome marker LAMP1 fluorescence in HEK293opt cells before and after blue light irradiation for 120 min. The white arrowheads indicate the colocalization of ADRB2CIB and LAMP1. Red, ADRB2CIB; green, LAMP1. Bar, 20 μm. (b) Temporal changes in the colocalization of ADRB2CIB with lysosomes in HEK293opt cells stimulated with blue light for the indicated time or with ISO for 120 min. Data are shown as the mean ± s.e.m. (n = 9 from two independent experiments) The statistical analysis was performed unpaired Student’s t-test (two-tailed). **P < 0.01 (P = 2.0 × 10⁻⁷). (c) IP-Western blotting analysis for the detection of ubiquitinated ADRB2CIB. HEK293opt cells were stimulated with blue light for the indicated time or with 1.0 μM ISO for 120 min. ADRB2CIB was immunoprecipitated using an anti-V5-tag antibody. Ubiquitin, ADRB2 and β-actin were blotted with antibodies specific to them. (d) The quantified temporal changes in ubiquitinated ADRB2CIB were calculated as the ratio of ubiquitinated ADRB2CIB to total ADRB2CIB quantities, which were determined in the Western blot analysis. The ratio values were normalized to their value at 0 min. Bars: mean ± s.e.m. (n = 9 from three independent experiments). The statistical analysis was performed unpaired Student’s t-test (two-tailed). **P < 0.01 (P = 1.1 × 10⁻⁴).

