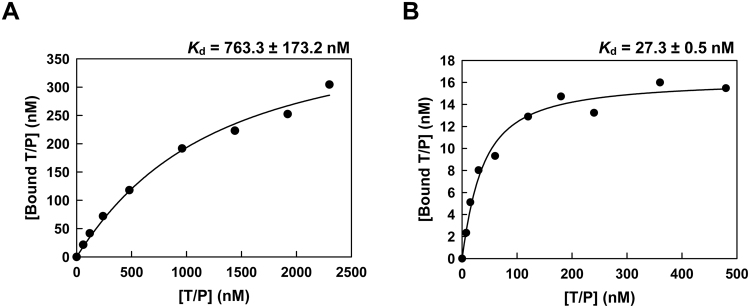
Figure 2.
Dissociation equilibrium constants (Kd) for T7 RNA polymerase and the VSR10 dsDNA/RNA heteroduplex. Data shown were obtained from representative assays carried out at pH 7.9 and 6 mM MgCl2 (panel A) and at pH 6.75 and 1.5 mM MgCl2 (panel B). The solid line represents the best fit of the data to the quadratic equation relating the template-primer bound to the T7 RNAP and the total concentration of the VSR10 heteroduplex. Reported Kd values represent averages ± standard deviations obtained from at least three independent experiments.

