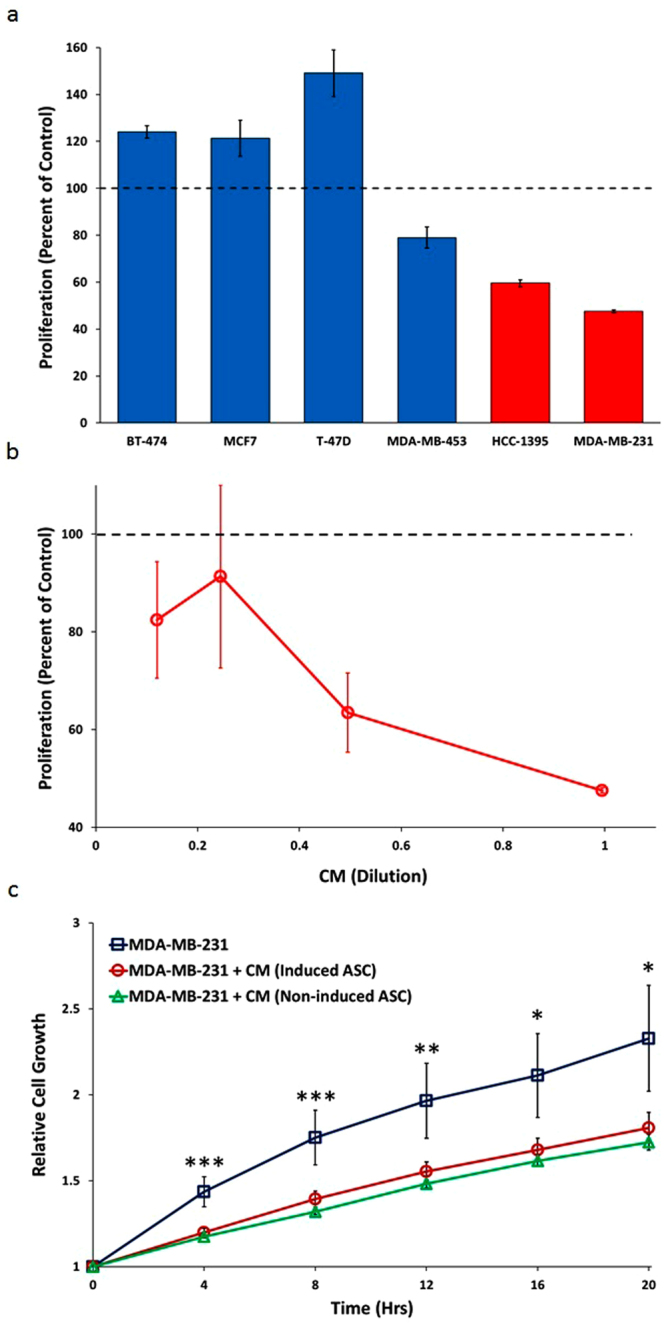
Figure 2.

Proliferative Response of Breast Cancer Cell Lines to CM from TNF-α/IFN-γ- Induced and Non-Induced Placental-Derived ASCs. (a) Proliferative response of the six breast cancer cell lines to undiluted CM from TNF-α/IFN-γ-induced-ASC in the 3D-spheroid assay. Red bars represent TNBC cell lines. Error bars represent SD (n = 3). (b) POC response curves for MDA-MB-231 in the 3D-spheroid assay upon serial dilution. Error bars represent SD (n = 3). (c) Inhibition of MDA-MB-231 2D growth in real time with CM from TNF-α/IFN-γ-induced and non-induced-ASCs. Error bars represent SEM (n = 4 for MDA-MB-231 with regular growth medium, n = 11 for MDA-MB-231 + induced-ASC CM, n = 8 for MDA-MB-231 + non-induced-ASC CM). P-values are based on ANOVA: ***p < 0.01, **p < 0.01, and *p < 0.05.
