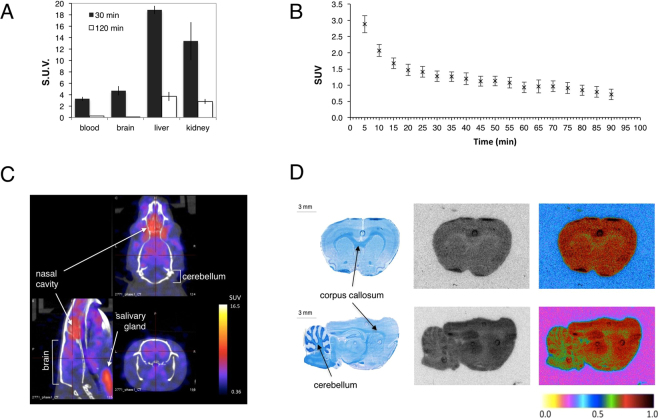
Figure 5.
Characterization of [18F]3-F-4-AP in control animals. (A) Organ distribution in mice measured using gamma counting (n = 4). (B) Time activity curves decay-corrected for the time of injection of the rat brain extracted from the quantification of 0–90 min dynamic PET scan in 5 min frames. Sprague Dawley rats received 0.15–0.30 μCi/g of [18F]3-F-4-AP via tail vein injection (n = 4, mean ± s.e.m). (C) Representative sagittal, axial and coronal fused PET/CT images. PET/CT images of the head were acquired 0 to 30 min post injection. (D) Representative LFB and autoradiography images (coronal and sagittal) of rat brains 30 min post injection of [18F]3-F-4-AP. Rats received 0.5–1 μCi/g via tail vein injection. There is high correlation between the LFB stain (myelin) and the autoradiography images.

