Figure 6.
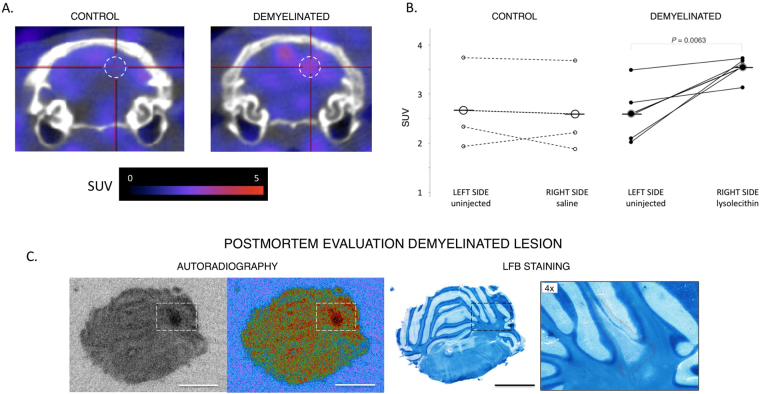
Detection of demyelination by PET and confirmation by autoradiography and histochemical staining. (A) Representative coronal fused PET/CT images of the cerebellum of injected rats. Sprague Dawley rats received 0.15–0.30 μCi/g of [18F]3-F-4-AP via tail vein injection. PET/CT images were acquired 0 to 25 min post injection. Dashed circle represents region of interest. (B) Quantification of the SUV of the lesioned and control regions of interest. There is significant increase in SUV on the on the LPC-injected animals (P = 0.0063) but not on the saline-injected animals. (C) Representative ex vivo autoradiography and LFB staining of LPC injected rat. (Scale bar: 4 mm). There is high correlation between PET, autoradiography and LFB staining.

