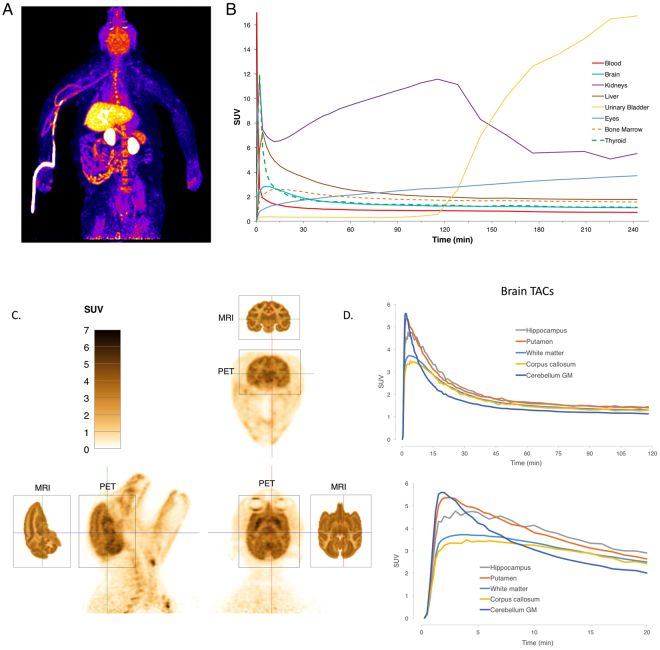
Figure 7.
Characterization of [18F]3-F-4-AP in Rhesus monkeys. (A) Maximum intensity projection of [18F]3-F-4-AP from 2–6 min post injection of one monkey. (B) Time activity curves for major organs decay-corrected for time of injection for the same monkey. (C) High resolution brain images from a second monkey (2–6 min). Corresponding MRI slices from NeuroMaps atlas are included for reference. (D) Corresponding decay-corrected time activity curves (0–120 min and 0–20 min) for selected brain regions.

