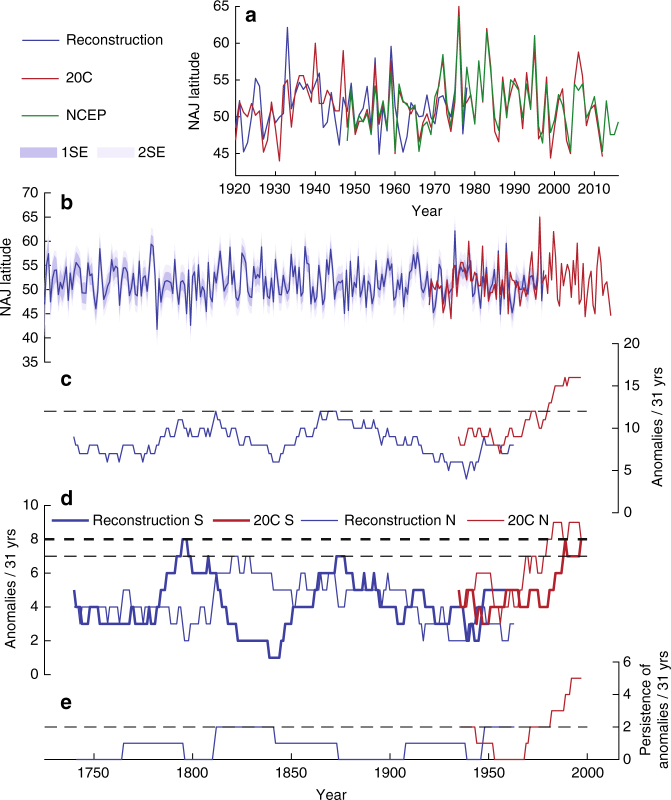
Fig. 3.
Summer NAJ reconstruction and variance. The reconstruction of the latitudinal position of the August NAJ was scaled and calibrated against NAJ position calculated based on twentieth century reanalysis data and explains 40% of its variance over the period of overlap (1920–1978; a). The NCEP/NCAR reanalysis data (1948–2016) are plotted for comparison in a. The full NAJ reconstruction (1725–1978) including combined error estimations is plotted in b. Running 31-year window number of NAJ anomalies (c), number of northern (N) and southern (S) NAJ anomalies (d), and persistence of anomalies (e) are plotted on the central year of the window for reconstructed (blue) and 20C Reanalysis (red) NAJ time series. Anomalies are defined as years when NAJ >1 stdev, with standard deviation calculated based on a merged time series of reconstructed (1725–1919) and 20C Reanalysis (1920–1978) NAJ values. Horizontal dashed lines in c–e represent the highest 31-year values over the reconstruction period (1725–1978)

