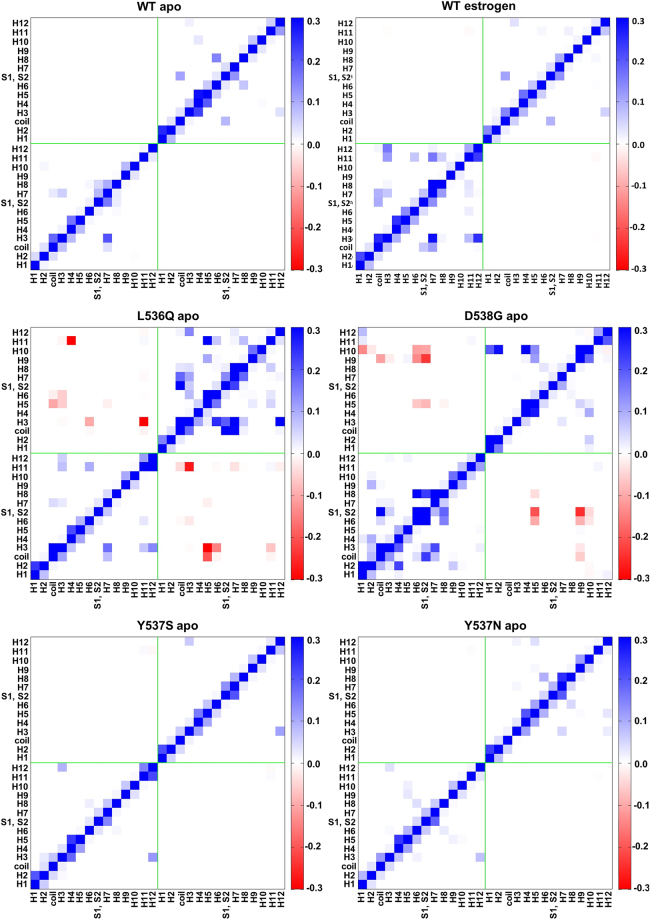
Figure 3.
Cross-correlation maps of 14 regions (as defined in Fig. 1) of both, apo monomers of WT and the selected mERαs, and WT/EST. The cross-correlation coefficients, calculated as the sum of the cross-correlation coefficients (with a correlation score ≥ or ≤ than 0.6 and −0.6) of the residues belonging to two regions considered (see Paragraph S2 for details). Cross-correlation scores are reported in the range from −0.3 to 0.3 for clarity reasons. Blue and red colours account for positive and negative correlation, respectively.

