Figure 1.
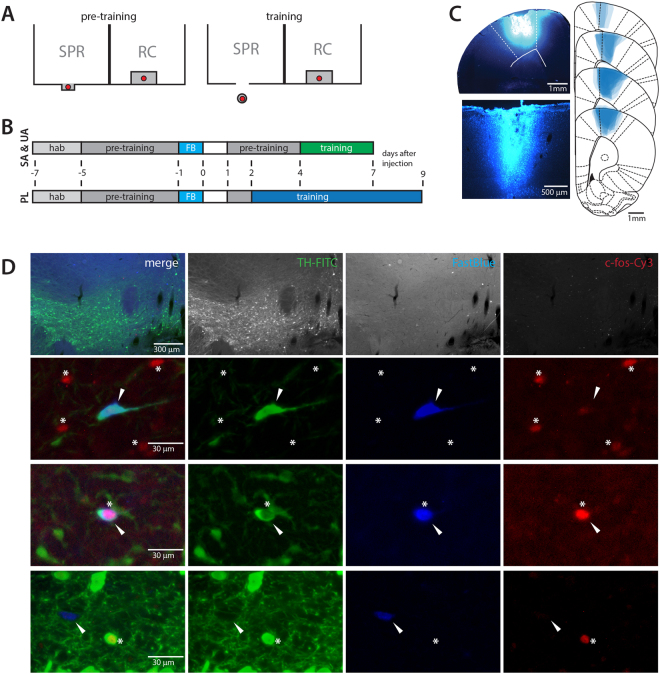
Overview of experimental setup and typical histological results. (A) Schematic drawing showing the front of the training apparatus and placement of food pellets (red) during pre-training and single pellet reaching (SPR) training for SPR rats (left part of the cage) and RC rats (right part of the cage). The pellet is placed within tongue-reach for SPR rats during pre-training and on a pedestal, that can only be reached by grabbing during single pellet reaching training. For RC rats, pellets are delivered to the inside of the cage whenever the SPR rat consumes one in both the pre-training and training phase. (B) Schematic of experimental setup for successful acquisition (SA), unsuccessful acquisition (UA) and plateau (PL) experiments. Numbers indicate time after FastBlue injection (FB). hab = habituation, training = single pellet reaching training. (C) Distribution of FastBlue in M1 after cortical injection. Representative photomicrographs showing dye injection and needle track in cortex (left) and extend of dye spread in sections 2.7-2 mm rostral of bregma (right). (D) Representative examples of VTA neurons positive for tyrosine hydroxylase (TH-FITC, green), FastBlue (FB, blue) and/or c-fos (c-fos-Cy3, red). Top row: 10x magnification, bottom rows: 40x magnification. Arrows indicate FB+ cell bodies. Asterisks denote position of c-fos+ nuclei.

