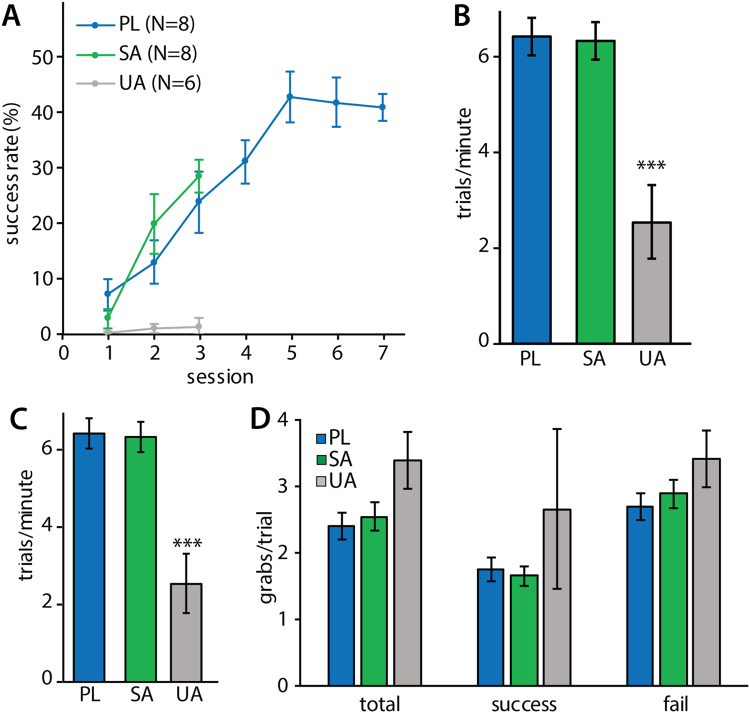
Figure 2.
Behaviour of SPR rats during task execution in SA (N = 8), UA (N = 6) and PL (N = 8) experiments. Values are mean ± s.e.m. (A) Learning curves showing percentage of successfully obtained pellets per training session. (B) Distance walked during the final training session. (***p ≤ 0.001 in Tukey’s HSD test) (C) Number of trials executed per minute during the final training session. (***p ≤ 0.001 in Tukey’s HSD test) (D) Number of grabbing attempts per trial in the final training session of SA (N = 8), UA (total and fail: N = 5 of 6, success: N = 2 of 6) and PL (N = 8) rats. 3 rats in the UA experiment did not achieve any successful trials.

