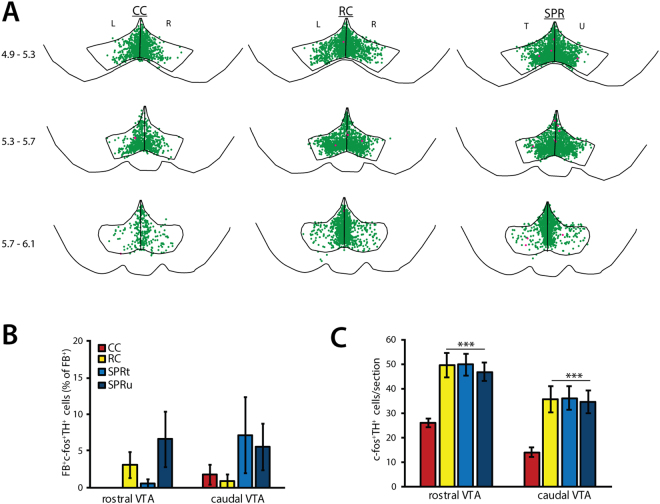
Figure 4.
c-fos expression in dopaminergic neurons during plateau task execution (PL, N = 8 per group). SPR = single pellet reaching, RC = reward control, CC = cage control. T = trained, U = untrained, L = left, R = right hemisphere. Values are mean ± s.e.m. (A) Superposition of TH+c-fos+ (green) and FB+ TH+c-fos++ (pink) neurons in VTA derived from 8 animals (2 sections per position per animal). Numbers indicate position relative to bregma. (B) Number of FB+TH+c-fos+ neurons in rostral and caudal VTA sections. (C) Number of TH+c-fos+ neurons in rostral and caudal VTA sections. (***p ≤ 0.001 in Tukey’s HSD test).

