Figure 2.
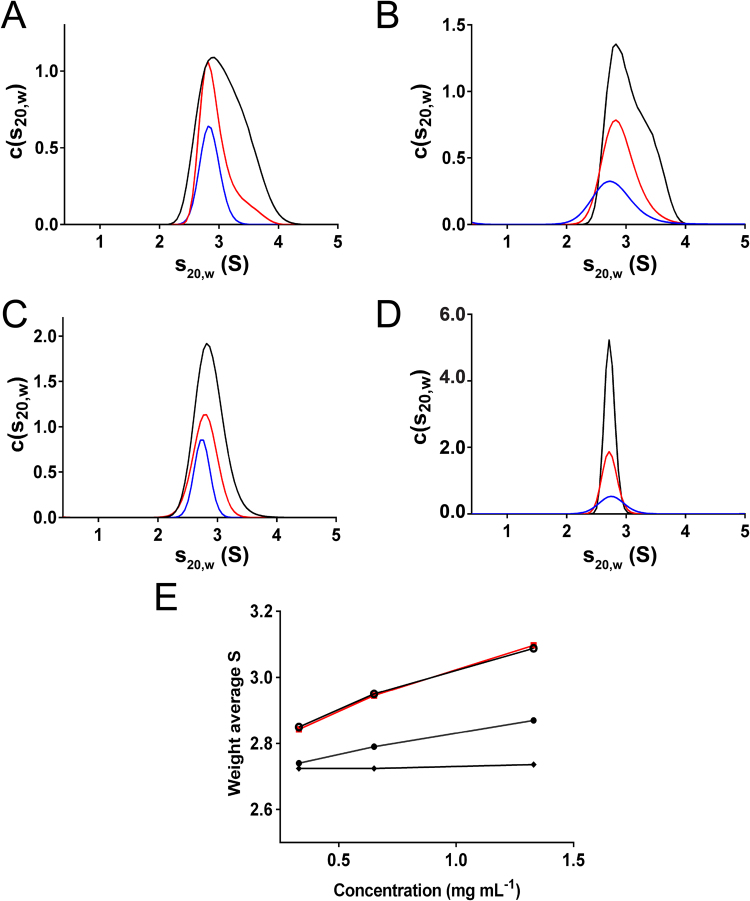
Sedimentation velocity analysis and concentration-dependent self-association of usGFP, sfGFP, EGFP and muGFP. Standardised continuous sedimentation coefficient [c(s20,w)] distributions for (A) usGFP, (B) sfGFP (C) EGFP and (D) muGFP at concentrations of 0.33 mg mL−1 (blue line), 0.65 mg mL−1 (red line) and 1.33 mg mL−1 (black line). (E) Weight average sedimentation coefficients for sfGFP (red squares), usGFP (open circles), EGFP (solid circles), and muGFP (solid diamonds), calculated from c(s20,w) distributions shown in panels (A–D) for usGFP, sfGFP, EGFP and muGFP. Distributions were integrated between 1 S and 5 S using SEDFIT.

