Figure 5.
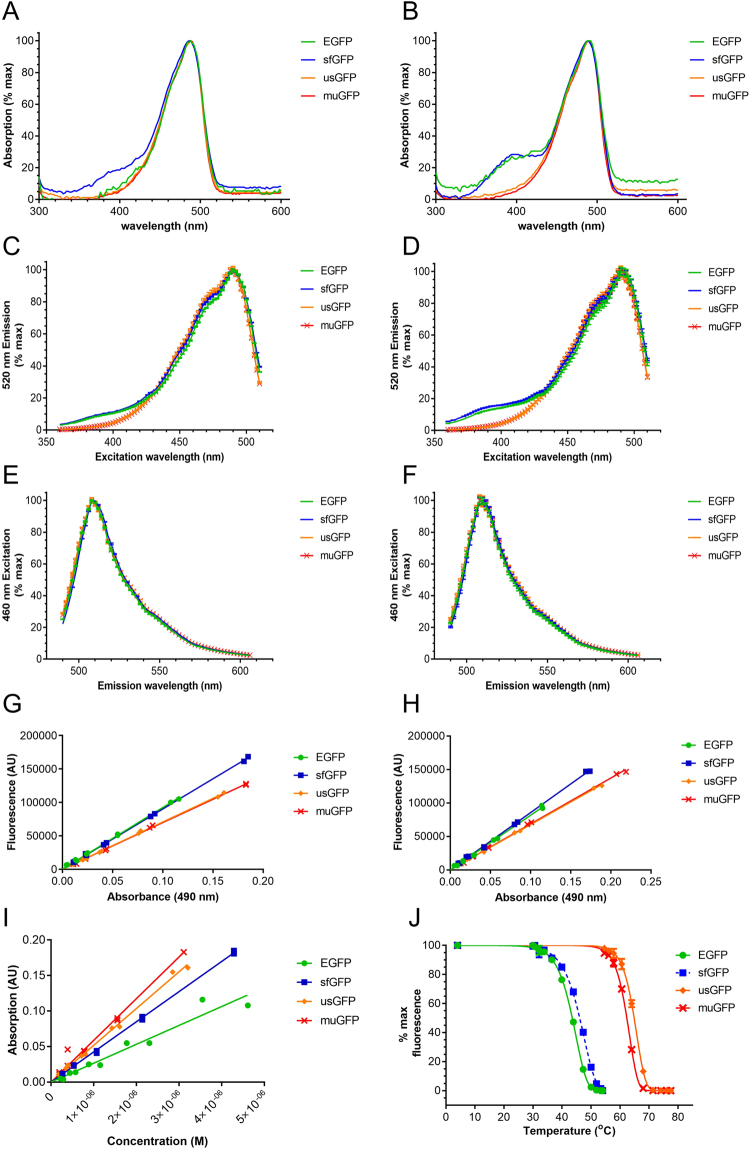
Spectral and stability characteristics of FPs. Purified EGFP (green symbols and lines), sfGFP (blue symbols and lines), usGFP (orange symbols and lines) and muGFP (red symbols and lines) were used to measure absorption, fluorescence excitation and fluorescence emission spectra in the absence (A,C and E respectively) and presence of 2% SDS (B,D and F respectively). Plotting absorbance against fluorescence for five concentrations of each FP allowed the calculation and comparison of quantum yields in the absence (G) and presence (H) of 2% SDS. Molar extinction coefficients were calculated for each variant by plotting protein concentration against absorbance at 490 nm (I). The fluorescence of EGFP (green solid circles and line), sfGFP (blue solid squares with dashed line), usGFP (orange diamonds with solid line) and muGFP (red crosses with solid line) was measured after incubation at the specified temperatures in the presence of 1% SDS for 30 min (J). The calculated apparent melting temperatures (Tm) are listed in Table 2, and were all significantly different from each other as determined by two-way ANOVA and Tukey’s multiple comparisons test.

