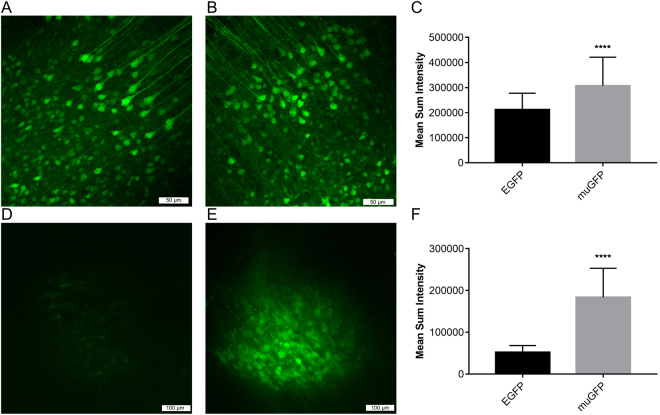
Figure 6.
Confocal imaging and fluorescence intensity quantification of pre- and post-CLARITY cleared sections of mouse cortex expressing EGFP and muGFP. Neurons of the primary somatosensory cortex of four mice were virally transduced with EGFP in the left hemisphere (A and D) and muGFP in the right hemisphere (B and E). Maximum projections from a representative brain of confocal image stacks from a fixed coronal brain section with no clearing, with EGFP transduced neurons (A) exhibiting slightly less fluorescence than muGFP transduced neurons (B). (C) The mean sum intensities of transduced neurons from two brains were calculated, with muGFP exhibiting significantly higher staining intensity. Maximum projections of confocal image stacks from a CLARITY cleared 3 mm section demonstrated that EGFP fluorescence was highly attenuated (D) compared to muGFP (E), which was quantified with sections from two brains (F). Groups were compared using an Exact Mann-Whitney ranksum test for equality of medians and **** indicates the medians were significantly different, p < 0.05.

