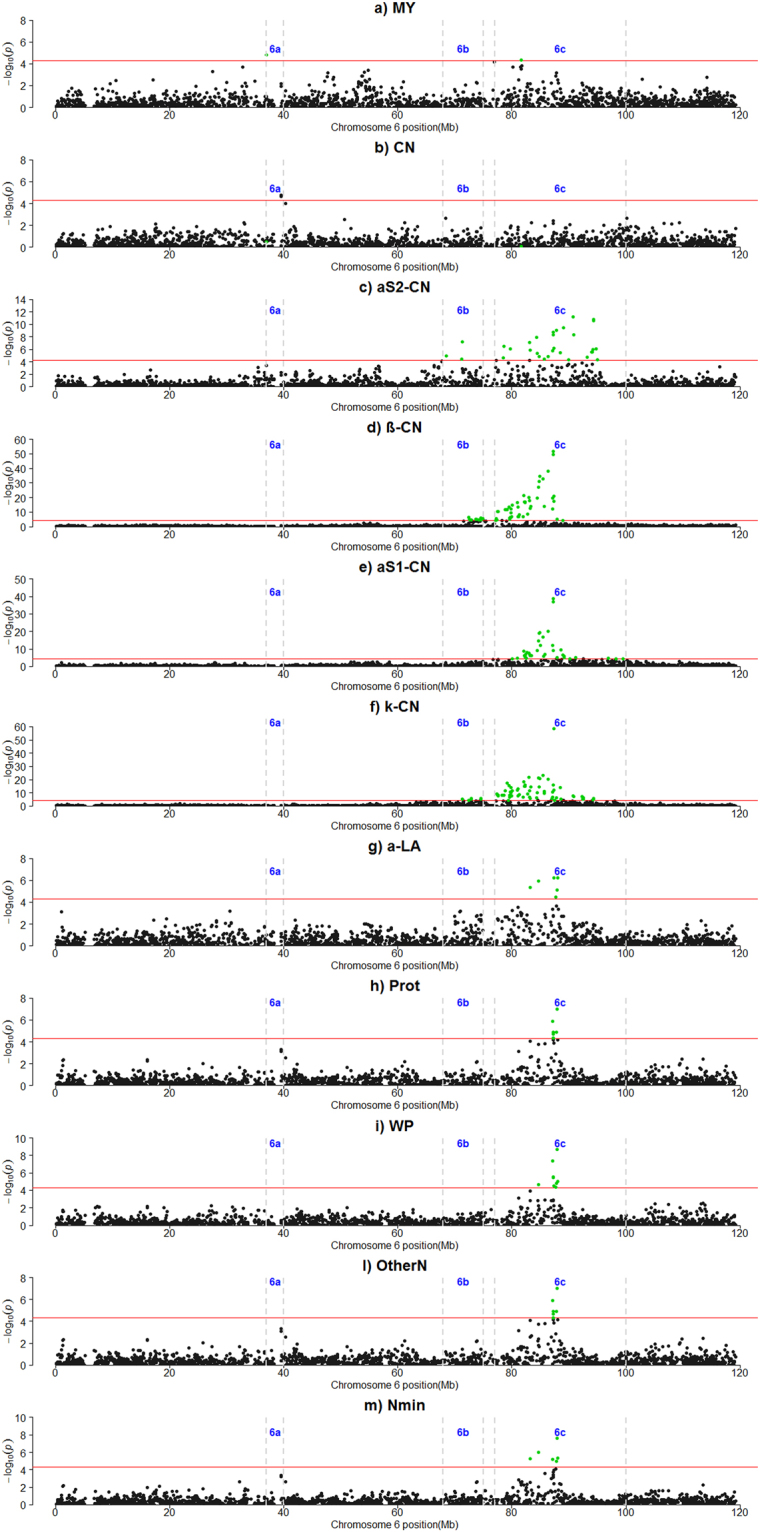
Figure 1.

Manhattan plots for the genome-wide association studies on Bos taurus autosome 6 (BTA6). (a) MY: milk yield; (b) CN: Σcaseins (β-CN+ κ-CN+ αS1-CN+ αs1 (phosphorylated)-CN+ αS2-CN+ αS1(phosphorylated)/αS1-CN); (c) aS2-CN: αS2-casein; (d) β-CN: β-casein; (e) aS1-CN: αS1-casein; (f) k-CN: κ-casein; (g) a-LA: α-lactal-bumin; (h) Prot: true protein nitrogen (N); (i) WP: Σ whey proteins (α-lactalbumin+ β-lactoglobulin); (l) OtherN: other N compounds (urea + minor N compounds); (m) Nmin: minor N compounds (small peptides, ammonia, creatine, creatinine, etc.). The red horizontal lines indicate a −log10 (P-values) of 4.30 (corresponding to P-value = 5 × ). 6a: region 6a; 6b: region 6b; 6c: region 6c.
