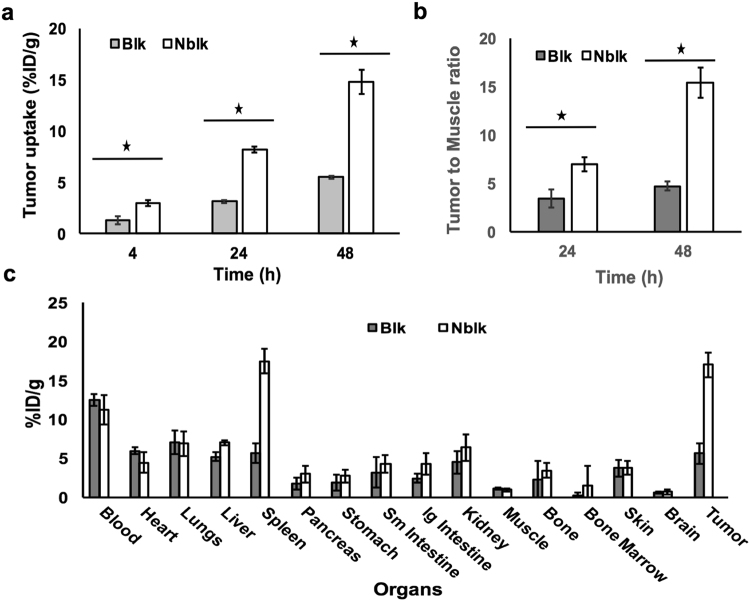
Figure 3.
64Cu-pembrolizumab tracer uptake in NSG/293 T/hPD-1 from ROI and ex vivo biodistribution measurements. (a) Region of interest (ROI) quantification of immunoPET tracer signal (mean ± SD % ID/g) from the xenograft of NSG mice, NSG/293 T/hPD-1-blk (blocking: n = 4) and NSG/293 T/hPD-1-nblk (non-blocking: n = 4), after 4 24, and 48 h post-injection, * indicates p < 0.001. (b) Xenograft-to-muscle background ratios (XMR) were computed from ROIs at 24 and 48 h p.i. The XMR in NSG/293 T/hPD-1-nblk mice were significantly greater than in NSG/293 T/hPD-1-blk mice, p = 0.001. (c) Biodistribution profiles of immunoPET tracer in NSG/293 T/hPD-1-blk and NSG/293 T/hPD-1-nblk mice were compared after 48 h microPET-CT scans. Tracer uptake in each tissue was computed as mean ± standard deviation % ID/g (decay-corrected). Unpaired two-tailed Student’s t test was used to compare mean values between groups.

