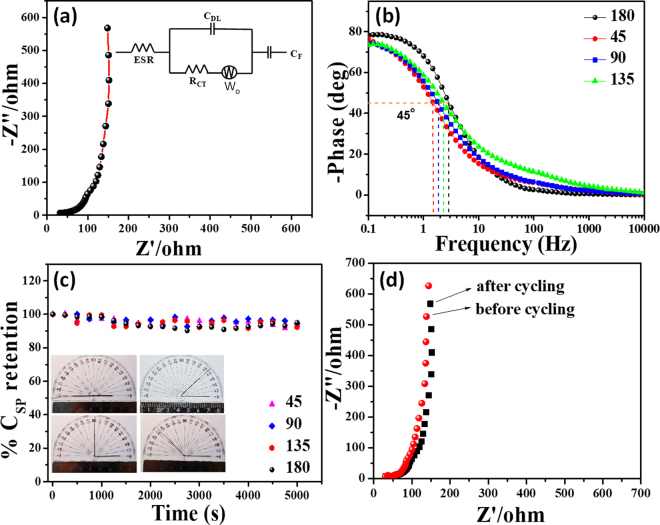
Figure 7.
(a,b) EIS analysis of the fabricated supercapacitor device; (a) shows Nyquist plot recorded in the frequency range of 100 kHz to 0.01 Hz and (b) shows the Bode plot of the device at different bending angles. (c) Durability test of the device recorded in the form of % retention of capacitance with the number of cycles. Inset shows the optical image of the device at different bending angle and corresponding stability data are given. (d) Nyquist plot before and after 5000 cycles.

