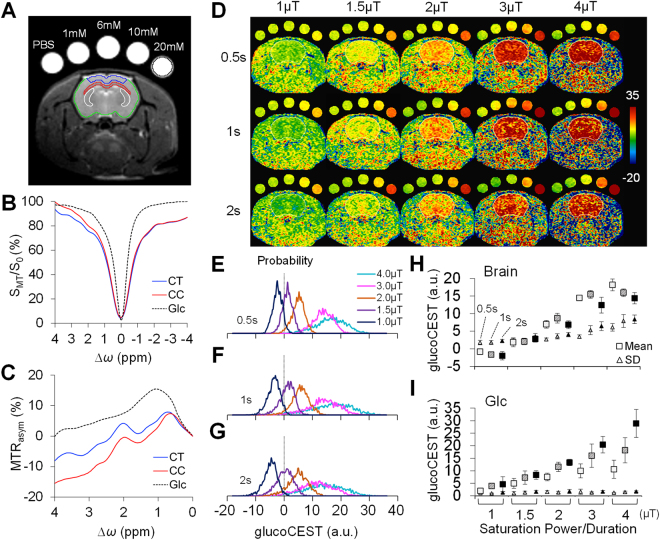
Figure 2.
The setup for in vivo glucoCEST-weighted imaging on normal brains. Animals were imaged with five glucose phantoms consisting of 1 × phosphate-buffered saline (PBS), 1, 6, 10, 20 mM glucose (Glc) for comparison (A). The regions of interest denote the areas for data quantification of the cortex (CT, blue), corpus callosum (CC, red), caudate-putamen complex (Cpu, white, data used in Fig. 6), entire brain (green) and 20 mM glucose phantom (black). The Z-spectra (B) and the MTRasym curves (C) acquired by 2 μT and 1 s saturation pulses showed CEST signals of Glc, CT and CC. The representative glucoCEST-weighted images were acquired using various saturation power and duration (D). While the glucoCEST-weighted images show clear contrast in response to different concentrations in phantoms, the glucoCEST images also differentiate contrast between CT and CC in the brain. The probability density of the brain glucoCEST signals is approximately Gaussian distributed for saturation duration of 0.5 s (E), 1 s (F) and 2 s (G). The averaged glucoCEST-weighted data in the brains (n = 6) show an increased mean and standard deviation (SD) by applying higher saturation power (H). In contrast, the signals in the 20 mM phantom increased in proportion to higher saturation power duration, while their SDs appear low across all experiments (I). (H) and (I) for each saturation power, points from the left to right denote the data acquired by 0.5 s (empty symbols), 1 s (pattern symbols), and 2 s (solid symbols) for saturation duration.

